Assess Model Size and Complexity for ISO 26262
You can use the Model Maintainability Dashboard to assess the size and complexity of your models in accordance with ISO 26262-6:2018. The dashboard monitors the design artifacts in your project and provides an overview of the size, complexity, and architecture of each software unit and component. The dashboard provides:
Quality metrics for complexity, at the model level, in accordance with the table in ISO 26262-6:2018, Clause 5.4.3
Quality metrics for the structure, size, and complexity of software components, and the size of interfaces, in accordance with the table in ISO 26262-6:2018, Clause 7.4.3
A list of the design artifacts in the project, organized by software units and components
To help you enforce low complexity and size in your design artifacts, follow these automated and manual review steps using the Model Maintainability Dashboard. For information on how to assess the quality and completeness of requirements-based testing activities, see Assess Requirements-Based Testing for ISO 26262.
Open Model Maintainability Dashboard
To analyze design artifacts using the Model Maintainability Dashboard:
Open a project that contains your design artifacts. For this example, in the MATLAB® Command Window, enter:
For information on how to create a project for your artifacts, see Create Project to Use Model Design and Model Testing Dashboards.openExample("slcheck/ExploreTestingMetricDataInModelTestingDashboardExample"); openProject("cc_CruiseControl");
To open the Model Maintainability Dashboard, use one of these approaches:
On the Project tab, in the Tools section, click Model Design Dashboard.
Open a model in the project and, in the Apps gallery, click Model Design Dashboard.
In the Command Window, enter:
modelDesignDashboard
The Dashboard window launches and opens a new Model Maintainability tab for the software component
cc_CruiseControl. The Model Maintainability Dashboard can collect metric results for the Units and Components in your project. To control what the dashboard classifies as a unit or component, see Categorize Models in Hierarchy as Components or Units.
The dashboard widgets summarize the size, architecture, and complexity measurements for the design artifacts associated with each software unit and component in the design. For more information about using the Model Maintainability Dashboard, see Monitor Design Complexity Using Model Maintainability Dashboard.
Review Maintainability Metrics for Design Artifacts
ISO 26262-6, Clause 5.4.3 requires that designs maintain a low complexity. ISO 26262-6, Clause 7.4.3 requires that designs demonstrate modularity and maintainability. To meet these requirements, use the appropriate software structure for your design and restrict the size and complexity of software components and interfaces.
The following is an example checklist to aid in reviewing design size, architecture, and complexity with respect to ISO 26262-6. For each checklist item, perform the review activity using the corresponding dashboard metric. Review and modify this example checklist to meet your application needs.
| Checklist Item | Review Activity | Dashboard Metric | Rationale |
|---|---|---|---|
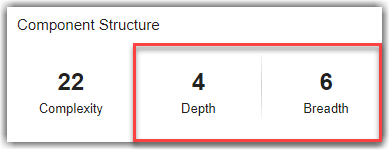
| 1 — Does the unit or component have low complexity at the model level? | Check that the overall design cyclomatic complexity is low. | In the Component Structure section, view the Complexity widget.
Metric ID —
For more information, see Overall Design Cyclomatic Complexity. | The overall design cyclomatic complexity is the total number of execution paths across the Simulink®, Stateflow®, and MATLAB design artifacts. In general, the more paths there are through a design, the more complex the design is. |
| 2 — Does the unit or component use an appropriate model structure? | Check that the maximum layer breadth and depth are low. Click the Depth widget to view a table of the model layers that contribute to the depth of the unit or component. Click the Breadth widget to view a table of the model layers that contribute to the breadth of the unit or component. | In the Component Structure section, view the Depth and Breadth widgets.
Metric ID —
Metric
ID — For more information, see Maximum Layer Depth and Maximum Layer Breadth. | In a model with a hierarchy of child models, the maximum layer depth calculates the maximum depth of the hierarchical children. The maximum layer breadth calculates the maximum number of direct children on a model layer. In a hierarchical model structure, the maximum depth and maximum breadth are typically proportional to each other. If one metric result is significantly larger than the other, the structure is not properly hierarchical. |
| 3 — Does the unit or component have a reasonable number of interfaces? | Check the size of component interfaces. Click the widgets in the Component Interface section to view tables of the interfaces associated with the design. | In the Component Interface section, view the widgets for Input Ports, Output Ports, Input Signals, Output Signals.
Metric ID —
Metric
ID —
For more information, see Input and Output Component Interface Ports and Input and Output Component Interface Signals. | The size of the component interfaces should be the minimum size that is appropriate for the design. The appropriate size of the interfaces is a size that is simple, modular, and maintainable. |
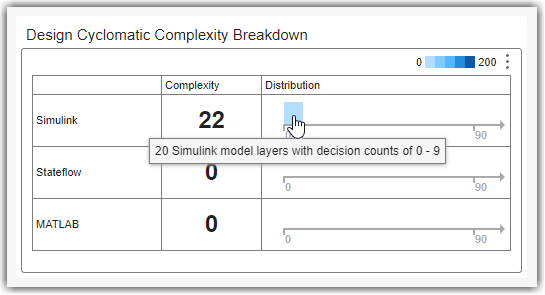
| 4 — Does each aspect of the design maintain a low complexity? | Check the design cyclomatic complexity values and decision count distributions associated with the Simulink, Stateflow, and MATLAB artifacts in the design. Click the widgets in the Design Cyclomatic Complexity Breakdown section to view tables that show the number of decisions associated with the design artifacts. | In the Design Cyclomatic Complexity Breakdown, view the values in the Complexity column and the distribution of decisions in the Distribution column. Point to a distribution bin to view more information.
Metric ID —
Metric
ID —
Metric
ID —
For more information, see Design Cyclomatic Complexity Breakdown. | The design cyclomatic complexity values for Simulink, Stateflow, and MATLAB are the total number of execution paths associated with those types of artifacts. In general, the more paths there are through a design, the more complex the design is. The Distribution column shows where decision paths occur in the design. |
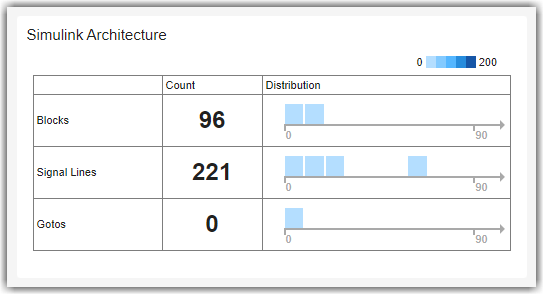
| 5 — Is each aspect of the design appropriately modular? | Check the architecture of the Simulink, Stateflow, and MATLAB artifacts in the design. Click the widgets in the Simulink Architecture, Stateflow Architecture, and MATLAB Architecture sections to view tables that show the number of decisions associated with the design artifacts. | In the Simulink Architecture, Stateflow Architecture, and MATLAB Architecture sections, view the values in the Count column and the distribution of decisions in the Distribution column. Point to a distribution bin to view more information.
| If parts of your design are large, make many decisions, or are difficult to read, the design can be difficult to test and maintain. Use the metric results to determine if you want to refactor your design to identify smaller testable units, or restructure a model to improve readability. |
Reference:
ISO 26262-6:2018(en) Road vehicles — Functional safety — Part 6: Product development at the software level, International Standardization Organization
See Also
Model Maintainability Metrics | metric.Engine


