获取可重用子系统的累积覆盖率
此示例显示如何创建和查看具有可重复使用子系统或可重复使用 Stateflow™ 图的模型的累计覆盖率结果。
Simulink® Coverage™ 为相同配置的多个实例提供累计覆盖率:
子系统
Stateflow 对象,例如图或库链接的子图
要获得累计覆盖率,请以编程方式添加单个覆盖率结果或使用运行按钮多次仿真模型。您可以通过添加单独的覆盖率结果来获得跨模型和测试框架的多个实例的累计覆盖率结果。有关累计覆盖率的更多信息,请参阅累积覆盖率数据。
打开示例模型
打开 slvnvdemo_cv_mutual_exclusion 模型。
modelName = "slvnvdemo_cv_mutual_exclusion";
open_system(modelName);

slvnvdemo_cv_mutual_exclusion 模型有两个可重用子系统实例,Subsystem 1 和 Subsystem 2。
分析决策覆盖率
为模型创建一个 Simulink.SimulationInput 对象。
simIn = Simulink.SimulationInput(modelName);
启用决策覆盖率分析。
simIn = setModelParameter(simIn,"CovEnable","on");
simIn = setModelParameter(simIn,"CovMetricStructuralLevel","Decision");
使用 CovScope 参数启用整个系统的覆盖率。
simIn = setModelParameter(simIn,"CovScope","EntireSystem");
启用 CovSaveSingleToWorkspaceVar 参数,并将覆盖率数据对象的名称设置为 covData。
simIn = setModelParameter(simIn,"CovSaveSingleToWorkspaceVar","on");
simIn = setModelParameter(simIn,"CovSaveName","covData");
使用 covInput 作为 sim 的输入来仿真模型。仿真输出对象在与 CovSaveName 参数同名的属性中包含覆盖率数据。对于此示例,使用 covData。
simOut = sim(simIn);
covData = simOut.covData;
提取并查看子系统覆盖率结果
使用 Subsystem 1 方法提取 cvdata.extract 的覆盖率数据。然后使用 Subsystem 1 为 cvhtml 创建 HTML 报告。
covDataSubsys1 = extract(covData,modelName+"/Subsystem 1");
cvhtml("subsystem1",covDataSubsys1);
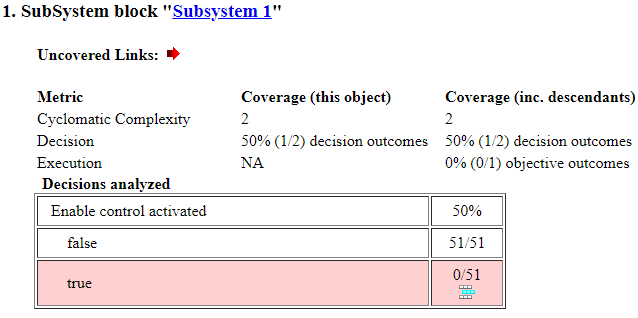
报告表明 Subsystem 1 的决策覆盖率为 50%。true 的 enable logical value 条件不满足。
提取并查看 Subsystem 2 的覆盖率数据。
covDataSubsys2 = extract(covData,modelName+"/Subsystem 2");
cvhtml("subsystem1",covDataSubsys2);
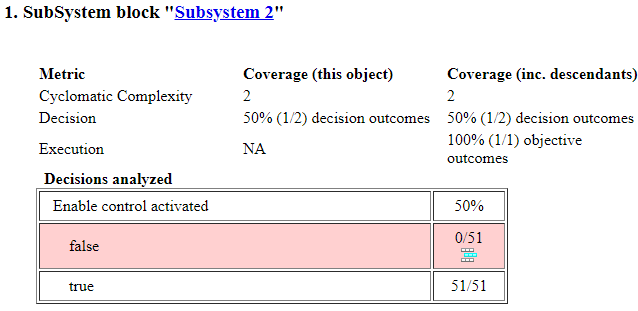
报告表明 Subsystem 2 的决策覆盖率为 50%。false 的 enable logical value 条件不满足。
生成聚合子系统覆盖率报告
使用 + 运算符合并两次仿真的覆盖率结果。
cumulativeCovData = covDataSubsys1 + covDataSubsys2;

% Create an HTML report for the cumulative decision coverage of |Subsystem
% 1| and |Subsystem 2|.

cvhtml('combinedData',cumulativeCovData);
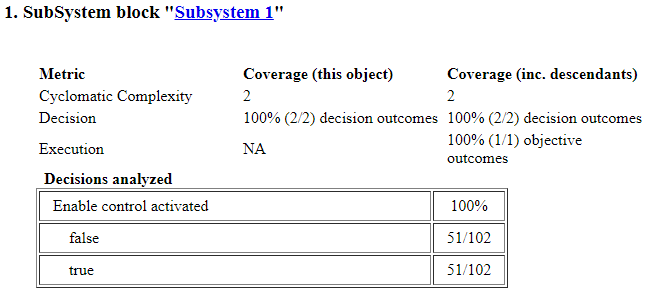
尽管两个不同的决策结果由子系统的不同实例满足,但聚合报告结合了两次仿真的数据,并报告 100% 的决策覆盖率。
在使用 extract 之前,将这些结果与原始覆盖率数据进行比较。
cvhtml('originalSystem',covData);
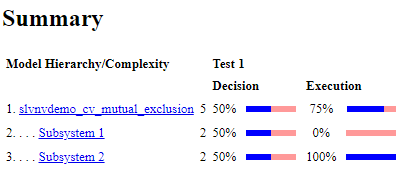
由于系统分析的覆盖率报告独立显示 Subsystem 1 和 Subsystem 2,因此它报告系统的决策覆盖率为 50%,总共 4 个决策结果中有 2 个得到满足。当您分析整个系统时,覆盖率报告不会查找相同系统或 Stateflow 图的多个实例。如果您想要合并相同子系统的覆盖率数据,则必须手动进行。
或者,您可以使用 Simulink Test™ 将单元级覆盖率数据聚合到系统级。请参阅将单元级覆盖率数据聚合到顶级模型覆盖率中。
另请参阅
cvhtml | sim | Simulink.SimulationInput | setModelParameter