Specify Variable Requirements in the App
In the Response Optimizer, you can specify the following constraints on Simulink® model parameters that are specified as variables:
Monotonic Variable — Impose Monotonic Constraint Requirement on Variable
Smoothness Constraint — Impose Upper Bound on Gradient Magnitude of Variable
Function Matching — Specify Linear or Quadratic Function Matching Constraint
Vector Property — Specify Requirement on a Vector Property
Relational Constraint — Impose Relational Constraint Between Two Variables
For information about how to specify a model parameter as a variable, see Add Model Parameters as Variables for Optimization. After you specify the constraints, you can see if the requirements are satisfied by optimizing the design variables. For more information, see Specify Optimization Options.
Impose Monotonic Constraint Requirement on Variable
You can impose a monotonic constraint requirement on a design variable in your Simulink model. For example, constrain a variable to be monotonically increasing. The variable can be a vector, matrix, or multidimensional array that is a parameter in your model, such as the breakpoints of a lookup table.
To specify the requirement:
In the Response Optimizer, in New drop-down menu, select Monotonic Variable.

In the Create Requirement dialog box, specify the requirement.

Specify a requirement name in Name.
Specify the name of the variable in Variable. The variable must be a vector, matrix, or multidimensional array of data type
doubleorsingle.You can type the name of a nonscalar variable, or select the variable from the drop-down list. The list is prepopulated with all the nonscalar variables in your model. To choose a subset of an array or matrix variable
V, type an expression. For example, specify Variable asV(1,:)to use the first row of the variable. To use a numeric nonscalar fieldxof a structureS, typeS.x. You cannot use mathematical expressions such asa + b.Sometimes, models have parameters that are not explicitly defined in the model itself. For example, a gain
kcould be defined in the MATLAB® workspace ask = a + b, whereaandbare not defined in the model butkis used. To add these independent parameters as variables in the Response Optimizer, see Add Model Parameters as Variables for Optimization.
Specify the monotonicity for each dimension of the variable.
After you select the variable, the dialog box updates to show Dimension 1 to Dimension n, corresponding to the n dimensions of the variable. For example, for a 2-dimensional variable
Kof size 3-by-5, the dialog box updates as shown.
Specify the monotonicity for the first dimension in Dimension 1 and for the nth-dimension in Dimension n as one of the following options:
Strictly increasing— Each element of the variable is greater than the previous element in that dimension.Increasing— Each element of the variable is greater than or equal to the previous element in that dimension.Decreasing— Each element of the variable is less than or equal to the previous element in that dimension.Strictly decreasing— Each element of the variable is less than the previous element in that dimension.Not constrained— No constraint exists between the elements of the variable in that dimension.
(Optional) To create an iteration plot that shows the evaluated requirement value for each optimization iteration, select Create Plot. The plot is populated when you perform optimization. The plot shows the evaluated requirement value corresponding to each dimension of the variable. A positive value indicates that the requirement has been violated.
Click OK.
A new variable, with the specified requirement name, appears in the Data area of the Response Optimizer app.
Impose Upper Bound on Gradient Magnitude of Variable
You can impose an upper bound on the gradient magnitude of a variable in your Simulink model. The variable can be a vector, matrix, or multidimensional array that is a parameter in your model, such as the data of a lookup table. For example, consider a car engine controller whose gain changes under different operating conditions determined by the car speed. You can use a gradient bound constraint to limit the rate at which the controller gain changes per unit change in vehicle speed.
For an N-dimensional variable F that
is a function of independent variables x1,..., xN,
the gradient magnitude is defined as:
To compute the gradient magnitude, the software computes the
partial derivative in each dimension by computing the difference between
successive F data in that dimension and dividing
by the spacing between the data in that dimension. You specify F and
the spacing between the data. The software checks whether the gradient
magnitude of the variable data is less than or equal to a specified
bound. If the gradient magnitude of the data is greater than the required
bound, the variable data is not smooth.
To specify the requirement:
In the Response Optimizer, in New drop-down list, select Smoothness Constraint.
In the Create Requirement dialog box, specify the requirement.

Specify a requirement name in Name.
Specify the gradient magnitude bound as a nonnegative finite real scalar in Gradient maximum magnitude.
Specify the variable
Fthat you want to impose the requirement on in Dependent Variable. The variable must be a vector, matrix, or multidimensional array of data typedoubleorsingle. The variable must be a parameter in your model or a constant that you enter.You can type the name of a nonscalar variable or constant, or select the variable from the drop-down list. The list is prepopulated with all the nonscalar variables in your model. To choose a subset of an array or matrix variable
V, type an expression. For example, specify Variable asV(1,:)to use the first row of the variable. To use a numeric nonscalar fieldxof a structureS, typeS.x. You cannot use mathematical expressions such asa + b.Sometimes, models have parameters that are not explicitly defined in the model itself. For example, a gain
kcould be defined in the MATLAB workspace ask = a + b, whereaandbare not defined in the model butkis used. To add these independent parameters as variables in the Response Optimizer, see Add Model Parameters as Variables for Optimization.
Specify the spacing between points of Dependent Variable data in each dimension in Independent Variable.
After you select the Dependent Variable, the dialog box updates to show Dimension 1 to Dimension n, corresponding to the n dimensions of the dependent variable. For example, for a 1-dimensional variable
K, the dialog box updates as shown.
The first dimension specifies the spacing going down the dependent variable data rows, and the second specifies spacing across the columns. The Nth dimension specifies the spacing along the Nth dimension of dependent variable data. You can specify the independent variables in each dimension as scalars or vectors.
Scalars — Specify the spacing between dependent variable data
Fin the corresponding dimension as a nonzero scalar. For example, suppose that Dependent Variable is two-dimensional, and the spacing between data in the first dimension is5and in the second dimension is2. In the Independent Variable section, specify Dimension 1 as5and Dimension 2 as2.Vectors — Specify the coordinates of
Fdata in the corresponding dimension as real, numeric, monotonic vectors. The software uses the coordinates to compute the spacing between the dependent variable data points in the corresponding dimension. The length of the vector must match the length ofFin the corresponding dimension. You do not have to specify coordinates with uniform spacing. For example, suppose thatFis two-dimensional, and the length of the data in the first and second dimension is3and5, respectively. The coordinates of the data in the first dimension are[1 2 3]. In the second dimension, the spacing is not uniform and the coordinates of the data are[1 2 10 20 30]. In the Independent Variable section, specify Dimension 1 as[1 2 3]and Dimension 2 as[1 2 10 20 30].
You can also specify the independent variables by typing the name of a variable, or selecting a variable from the drop-down list. The list is prepopulated with all the variables in your model that have the appropriate size. To choose a subset of an array or matrix variable
V, type an expression. For example, specify asV(1,:)to use the first row of the variable. To use a numeric fieldxof a structureS, typeS.x. You cannot use mathematical expressions such asa + b.
(Optional) To create an iteration plot that shows the evaluated requirement value for each optimization iteration, select Create Plot. The plot is populated when you perform optimization. A positive value indicates that the requirement has been violated.
Click OK.
A new variable, with the specified requirement name, appears in the Data area of the Response Optimizer.
Specify Linear or Quadratic Function Matching Constraint
In the app, you can constrain a variable's values to match a linear or quadratic function. The variable can be a vector, matrix, or a multidimensional array that is a parameter in your model, such as the data of a lookup table in your model. To specify the requirement:
In Response Optimizer, from the New drop-down list, select Function Matching.
In the Create Requirement dialog box, specify the requirement. A new requirement with the name specified in Name appears in the Requirements area of the app.
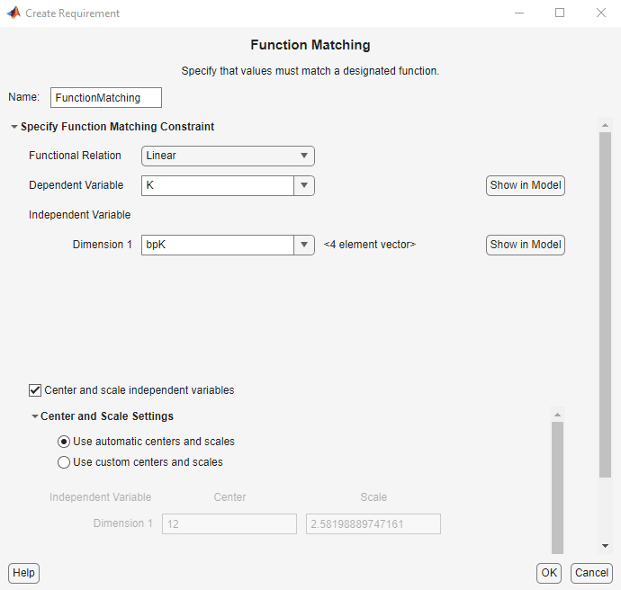
Specify the function to be matched. To do so, set Functional Relation to one of the following values:
Linear— Data from variableVare fit to a linear function. For example, for a two-dimensional variable with independent variables,X1andX2, the linear function has the form:The software calculates the fit coefficients
a0,a1, anda2and then calculates the sum of squares of the error between the data and the linear function.Quadratic with no cross-terms— Data are fit to a quadratic function with no cross-terms. For a two-dimensional variable, the pure quadratic function has the form:Quadratic with all cross-terms— Variable data are fit to a quadratic function that includes cross-terms. For a two-dimensional variable, the quadratic function has the form:If the variable is one-dimensional, there are no cross-terms and so the computation is the same as when Functional relation is
Quadratic with no
                                    cross-terms
.
Specify the variable
Vto which you want to apply the requirement in Dependent Variable. The variable must be a vector, matrix, or multidimensional array of data typedoubleorsinglethat is a parameter in your model.Type the name of a nonscalar variable, or select a variable from the drop-down list. The list is prepopulated with all the nonscalar variables in your model. To see where the selected variable is used on your model, click Show in Model. To choose a subset of an array or matrix variable
A, type an expression. For example, specifyA(1,:)to use the first row of the variable. To use a numeric nonscalar fieldxof a structureS, typeS.x. You cannot use mathematical expressions such asa + b.Sometimes models have parameters that are not explicitly defined in the model itself. For example, a gain
kcould be defined in the MATLAB workspace ask = a + b, whereaandbare not defined in the model butkis used. To add these independent parameters as design variables in the app, see Add Model Parameters as Variables for Optimization.Specify the independent variable vectors used for computing the function in Independent Variable. The independent variables are specified as real, numeric, monotonic vectors.
The number of independent variables must equal the number of dimensions of the dependent variable
V. For example, you specify two independent variables whenVis a matrix, and use three independent variables whenVis three-dimensional. The first independent variable vector specifies coordinates going down the rows ofV, and the second independent variable vector specifies coordinates going across the columns ofV. The nth independent variable vector specifies coordinates along the nth dimension ofV. The number of elements in each independent variable vector must match the size ofVin the corresponding dimension. The independent variable vectors must be monotonically increasing or decreasing.You can also specify the independent variables by typing the name of a variable, or selecting a variable from the drop-down list. The list is prepopulated with all the variables in your model that have the appropriate size. To choose a subset of an array or matrix variable
A, type an expression. For example, specifyA(1,:)to use the first row of the variable. To use a numeric fieldxof a structureS, typeS.x. You cannot use mathematical expressions such asa + b. To use an equally spaced vector, select[1 2 ...N]from the drop-down menu.Specify whether you want to center and scale the independent variables. When you select the Center and scale independent variables option, the independent variable vectors you specify are divided by a scale value after subtracting a center value. Centering can improve numerical conditioning when one or more independent variable vectors have a mean that differs from 0 by several orders of magnitude. Scaling can improve numerical conditioning when independent variable vectors differ from each other by several orders of magnitude.
To specify the center and scale values for each independent variable, expand the Center and Scale Settings section, and select one of the following:
Use automatic centers and scales - The center and scale values are the mean and standard deviation for each independent variable. Using the mean and standard deviation values to center and scale the independent variables is the default option.
Use custom centers and scales - Specify the Center and Scale values for each independent variable. The independent variable vectors are divided by the corresponding Scale value after subtracting the value you specify in Center.
(Optional) Select the Create Plot option to create an iteration plot that shows the evaluated requirement value for each optimization iteration. The software computes an error signal that is the difference between the dependent variable data and the specified function of the independent variables. The sum of squares of this error is plotted when you perform optimization. A positive value indicates that the requirement has been violated, and
0value indicates that the requirement is satisfied. The closer the value is to0, the better the match between the function and dependent variable data.Close the Create Requirement dialog box.
The requirement created in the Requirements area of the app is updated with the specified characteristics.
Specify Requirement on a Vector Property
You can specify a requirement on a vector property, such as the mean value of the vector. The vector must be a parameter in your model. To specify the requirement:
In the Response Optimizer, in New drop-down list, select Vector Property.
In the Create Requirement dialog box, specify the requirement.

Specify a requirement name in Name.
Specify the vector property in Property. For a vector V with N elements, you can specify one of the following properties:
Vector mean— mean(V)Vector median— median(V)Vector variance— variance(V)Vector inter-quartile range— Difference between the 75th and 25th percentiles of the vector values.Vector sum—Vector sum of squares—Vector sum of absolute values—Vector minimum— min(V)Vector maximum— max(V)
Specify the type of requirement you want to impose on the vector property in Type. You can set an upper or lower bound on the vector property, or require the property to equal a particular value. You can also choose to maximize or minimize the vector property. For example, to maximize the mean value of your vector, specify Property as
Vector meanand Type asMaximize the property.Specify the value of the bound imposed on the vector property in Bound. Specify the bound as a finite real scalar value. For example, if for a vector variable V you require
mean(V) = 5, specify Property asVector mean, Type asConstrain property to be == the bound, and Bound as5.
Specify the name of the variable in Variable. The variable must be a vector, matrix, or multidimensional array of data type
doubleorsingle.You can type the name of a nonscalar variable, or select the variable from the drop-down list. The list is prepopulated with all the nonscalar variables in your model. To choose a subset of an array or matrix variable
V, type an expression. For example, specify Variable asV(1,:)to use the first row of the variable. To use a numeric nonscalar fieldxof a structureS, typeS.x. You cannot use mathematical expressions such asa + b.Sometimes, models have parameters that are not explicitly defined in the model itself. For example, a gain
kcould be defined in the MATLAB workspace ask = a + b, whereaandbare not defined in the model butkis used. To add these independent parameters as variables in the Response Optimizer, see Add Model Parameters as Variables for Optimization.(Optional) To create an iteration plot that shows the evaluated requirement value for each optimization iteration, select Create Plot. The plot is populated when you perform optimization. A positive value indicates that the requirement has been violated.
Click OK.
A new variable, with the specified requirement name, appears in the Data area of the Response Optimizer app.
Impose Relational Constraint Between Two Variables
You can impose a relational constraint requirement on a pair of variables in your Simulink model. For example, require that variable a is always greater than variable b. To specify the requirement:
In the Response Optimizer, in New drop-down list, select Relational Constraint.
In the Create Requirement dialog box, specify the requirement.
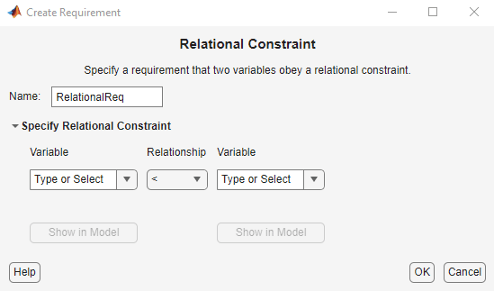
Specify a requirement name in Name.
Specify the name of the two variables in Variable. The variables can be vectors or arrays but must be the same size.
Type the names of two variables, or select the variables from the drop-down lists. The lists are prepopulated with all the variables in your model. To see where a selected variable is used on your model, click Show in Model. To choose a subset of an array or matrix variable
V, type an expression. For example, specify Variable asV(1,:)to use the first row of the variable. To use a numeric fieldxof a structureS, typeS.x. You cannot use mathematical expressions such asa + b.Sometimes, models have parameters that are not explicitly defined in the model itself. For example, a gain
kcould be defined in the MATLAB workspace ask = a + b, whereaandbare not defined in the model butkis used. To add these independent parameters as variables in the Response Optimizer, see Add Model Parameters as Variables for Optimization.
Specify the relation between the elements of the two variables as one of the following in Relationship:
'<'— Each data element in the first variable is less than the corresponding element in the second variable.'<='— Each data element in the first variable is less than or equal to the corresponding element in the second variable.'>'— Each data element in the first variable is greater than the corresponding element in the second variable.'>='— Each data element in the first variable is greater than or equal to the corresponding element in the second variable.'=='— Each data element in the first variable is equal to the corresponding element in the second variable.'~='— Each data element in the first variable is not equal to the corresponding element in the second variable.
(Optional) To create an iteration plot that shows the evaluated requirement value for each optimization iteration, select Create Plot. The plot is populated when you perform optimization. The plot shows the evaluated requirement value corresponding to each element of the variables. The interpretation of the evaluated requirement value depends on the requirement Type.
Type Evaluated Requirement Value Requirement is Satisfied Requirement is Violated '>'or'<'Negative number Positive number, or 0if the elements are equal'>='or'<='Negative number, or 0if the elements are equalPositive number '=='0Non-zero number '~='01Click OK.
A new variable, with the specified requirement name, appears in the Data area of the Response Optimizer app.