Plot Signal Data Logged to Workspace by Simulink Desktop Real-Time
To visualize non-real-time simulated data or real-time application data, use the MATLAB® plotting functions.
After running your real-time application and logging data to the MATLAB workspace, you can plot the data.
This procedure uses the model sldrtex_model. To open this model, in
the MATLAB Command Window, type:
openExample('sldrtex_model')The procedure assumes that you saved your data to the variable
ScopeData.
The steps in this procedure assume that you have already loaded that model and have completed the steps in Set Scope Parameters for Logging to Workspace and Set Run in Kernel Mode Properties for Logging to Workspace.
In the Simulink® Editor, on the Desktop Real-Time tab, click Run in Real Time.
When the real-time application runs, it creates the
ScopeDatavariable that you configured in Set Run in Kernel Mode Properties for Logging to Workspace.To show the structure of the variable
ScopeData, in the MATLAB Command Window, type:ScopeData
ScopeData =

  struct with fields:

         time: [2001×1 double]
      signals: [1×1 struct]
    blockName: 'sldrtex_model/Scope'
To list the contents of the structure
signals, type:ScopeData.signals
ans =

  struct with fields:

        values: [2001×1 double]
    dimensions: 1
         label: ''
         title: ''
     plotStyle: 0
To plot the first
1000points, type:plot(ScopeData.time(1:1000),ScopeData.signals.values(1:1000))
The MATLAB environment plots the first
1000samples over0.0000–0.9990seconds.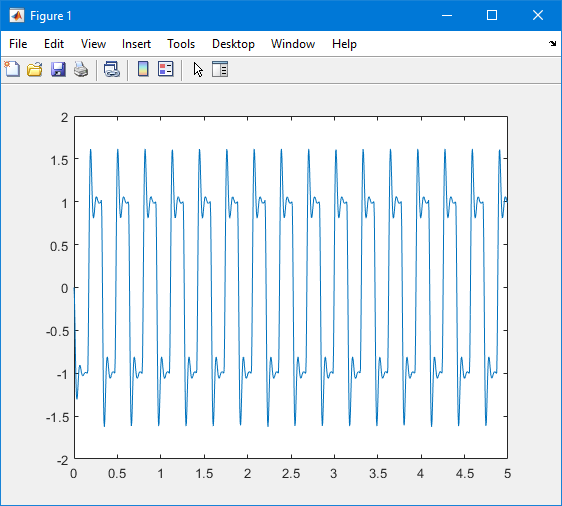
The variable
ScopeDatais not automatically saved to your hard disk. To save the variableScopeData, type:save ScopeDataThe MATLAB environment saves the scope data to the file
ScopeData.mat.