调试 Requirements Table 模块
您可以在 Requirements Table 模块中调试形式化需求。Requirements Table 模块包含一些与 MATLAB® 编辑器中相同的调试工具。要使用调试器,请在至少一个需求上设置断点并运行仿真。当您创建和编辑需求时,Requirements Table 模块还会检查错误的表格单元格。
向需求集添加断点
此示例使用 使用 Requirements Table 模块仿真骰子游戏规则 中的模型。要调试 Requirements Table 模块需求:
打开示例模型
Dice Game Rules中的 Requirements Table 模块ReqTableDiceGame:openExample('slrequirements/DiceGameReqTableBlockExample') open_system("ReqTableDiceGame/Dice Game Rules");
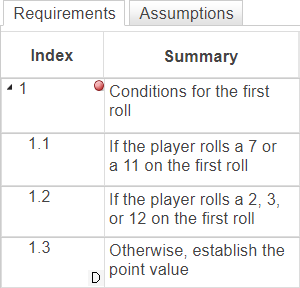
右键点击索引为
1的需求,然后点击设置断点。需求在索引旁边显示断点图标 。
。
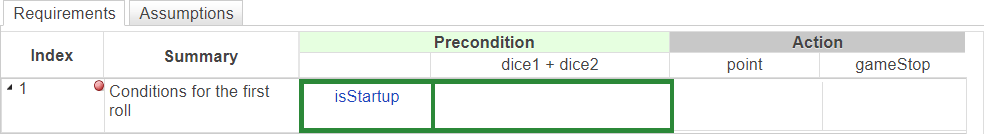
选择需求评估期间仿真暂停的时间。点击断点以展开选项:
在检查预条件前 - 在模块检查前提条件之前,仿真停止。
在预条件有效后 - 仅当前提条件为真时,仿真才会停止。
如果清除这两个选项,表将删除断点。如果选择两个选项,则该模块会创建两个断点。
在此示例中,选择在检查预条件前并清除在预条件有效后。
仿真模型。当执行到达断点时,仿真暂停。该模块以绿色突出显示了仿真停止的前提条件。
当仿真在断点处暂停时,您可以使用调试选项卡中的按钮以其他方式继续执行:
按钮 描述 继续 继续执行到下一个断点。 越过 前进到需求集执行的下一步。可能的步骤包括:
评估前提条件或后条件
执行操作。当您跨过时,每个动作单元都会从左到右执行。如果操作单元包含多行,则在跨过时执行操作的每一行。
步入 从预条件、后条件或调用函数的操作,前进到函数中的第一个可执行语句。
否则,进入需求集执行的下一步。当您进入时,每个动作单元从左到右执行。如果操作单元包含多行,则在进入时执行操作的每一行。
步出 从函数调用返回到调用该函数的需求预条件、后条件或动作。
否则,继续执行到下一个断点。
停止 退出调试模式并中断执行。 在这个示例模型中,点击继续可进入下一个时间步或结束仿真。
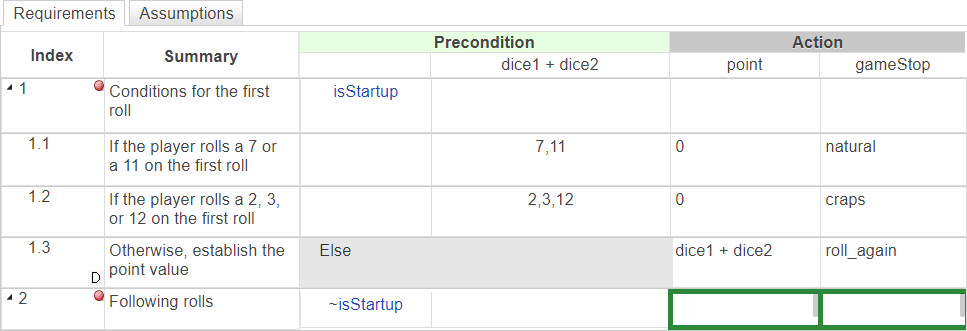
使用多个断点
您可以向 Requirements Table 模块添加多个断点。该模块首先评估列出的需求,然后向下进行。请参阅在 Requirements Table 模块中建立层次结构。
在 Dice Game Rules 模块中,为索引为 2 的需求添加一个断点,清除在检查预条件前,选择在预条件有效后,并仿真模型。点击继续以前进到下一个断点或下一个时间步。在第一个时间步中,索引为 2 的需求不会暂停仿真。但是,如果玩家设置了点值,则仿真会在下一个时间步的两个断点处暂停。
再次运行仿真,但点击越过或步入。调试器在模块执行的每个步骤处都会暂停。根据结果,调试器只在其中一个操作处停止,但会评估几个预条件。
查看断点处的仿真状态
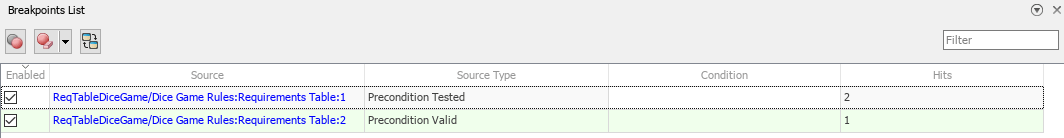
您可以在断点列表窗格中查看有关断点的其他信息。要打开窗格,点击断点,然后点击断点列表。断点列表窗格显示五列:
| 列标题 | 描述 |
|---|---|
| 已启用 | 指定断点是否启用。当您在需求上禁用在检查预条件前和在预条件有效后时,断点图标为灰色 |
| 源 | 指定断点的位置。 |
| 源类型 | 模块是在检查前提条件之前还是在前提条件有效之后检查需求。 |
| 条件 | 指定仿真暂停前必须为真的逻辑表达式。使用 Requirements Table 模块数据和文字值指定表达式。该表达式的计算结果必须为逻辑 true (1) 或 false (0)。 |
| 命中数 | 指定仿真在断点处暂停的次数。 |
在 Dice Game Rules 模块中,断点列表窗格列出了两个断点。运行模型以查看运行调试器时每个断点暂停仿真的次数。窗格突出显示了仿真暂停的断点。
在仿真过程中观测数据值
您可以在仿真时使用符号窗格或命令行窗口跟踪模块中的数据值。
查看符号窗格中的数据值
要在仿真期间查看 Requirements Table 模块中的符号窗格的数据值:
打开符号窗格。在建模选项卡的设计数据部分中,点击符号窗格。
为需求添加断点。
运行模型。
当仿真暂停时,符号窗格会显示断点处的值。如果数据是数组,则数据列显示数据的维度和数据类型。在这个示例中,数据是标量。

使用命令行调试器查看模块数据
您可以在 MATLAB 命令行窗口中查看模块数据的值。当到达断点时,在 debug>> 提示符下输入数据的名称以查看其值和数据类型。
debug>> dice1

	int8

	5

debug>>
您还可以在调试时在命令行窗口中输入以下命令:
| 命令 | 描述 |
|---|---|
| 继续执行到下一个断点。 |
| 遇到断点后前进到下一步执行。 |
| 退出调试并终止仿真。 |
| 显示命令行调试的帮助。 |
| 显示当前时间步和断点处数据 |
| 将当前时间步和断点的数据保存到指定的文件。该命令使用 MATLAB |
| 如果数据在模块中定义,则相当于 |
| 显示模块中定义的数据。 |
| 显示模块中定义的数据的大小和类型。 |
要在 debug>> 提示符下的 MATLAB 基础工作区中发出命令,请使用 evalin 命令,第一个参量为 "base",后跟第二个参量命令,例如 evalin("base","whos")。您不能在 debug>> 提示符下定义或更改数据。
解决单元格错误
当模块识别出语法错误或在符号窗格中未定义的数据时,会出现表单元格错误。指向或点击单元格旁边的警告图标 ![]() 以阅读错误消息。如果您在没有解决这些问题的情况下运行仿真,诊断查看器将显示有关错误的详细信息。
以阅读错误消息。如果您在没有解决这些问题的情况下运行仿真,诊断查看器将显示有关错误的详细信息。
编辑表格单元格时,该模块不会检测所有问题。例如,如果需求的持续时间计算为向量或矩阵,则会发生编译错误。这些警告和错误出现在诊断查看器中。