Bind a Simulink Function to a State
When a Simulink® function resides inside a state, the function binds to that state. Binding results in the following behavior:
Function calls can occur only in state actions and on transitions within the state and its substates.
When the state is entered, the function is enabled.
When the state is exited, the function is disabled.
For example, the following Stateflow® chart shows a Simulink function that binds to a state.
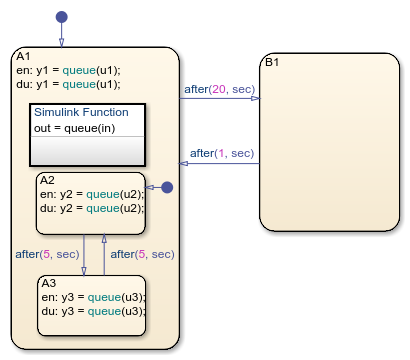
Since the function queue resides in state A1, the
function binds to state A1.
State
A1and its substatesA2andA3can call the functionqueue, but stateB1cannot.When state
A1is entered,queueis enabled.When state
A1is exited,queueis disabled.
Control Subsystem Variables When the Simulink Function Is Disabled
If a Simulink function binds to a state, you can hold the subsystem variables at their values from the previous execution or reset the variables to their initial values. To choose the desired behavior for your subsystem, follow these steps:
In the Simulink function, double-click the trigger port to open the Block Parameters dialog box.
Select an option for States when enabling.
Option Description heldHolds the values of the subsystem variables from the previous execution resetResets the subsystem variables to their initial values
Binding a Simulink Function to a State
This example shows how a Simulink function behaves when bound to a state.
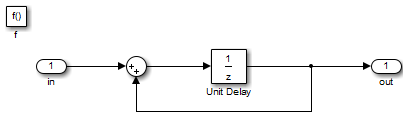
The function queue contains a block diagram that increments a counter
by 1 each time the function executes.
The Block Parameters dialog box for the trigger port appears as follows.
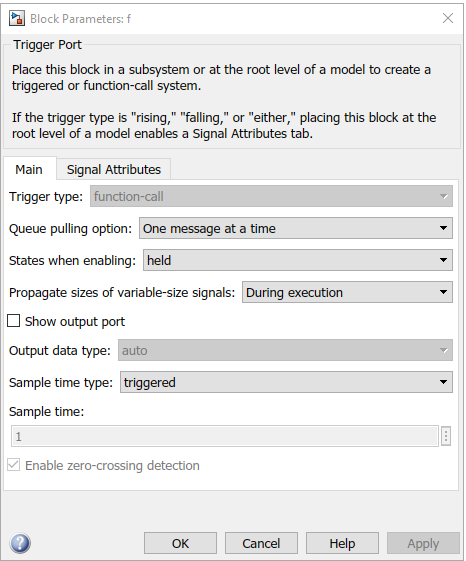
In the dialog box, setting Sample time type to
periodic enables the Sample time field,
which defaults to 1. These settings tell the function to execute for each time step
specified in the Sample time field while the function is
enabled.
If you use a fixed-step solver, the value in the Sample time field must be an integer multiple of the fixed-step size. This restriction does not apply to variable-step solvers. For more information, see Compare Solvers (Simulink).
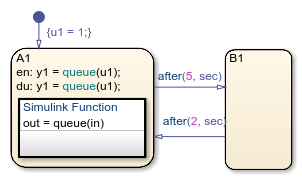
Simulation Behavior of the Chart
When you simulate the chart, the following actions occur.
The chart takes the default transition to state
A1, and the local datau1is set to 1.When
A1is entered, the functionqueueis enabled.Function calls to
queueoccur until the conditionafter(5, sec)is true.Once the condition is true, the transition from state
A1toB1occurs.When
A1is exited, the functionqueueis disabled.After two more seconds pass, the transition from
B1toA1occurs.Steps 2 through 6 repeat until the simulation ends.
Function Behavior When Variables Are Held
If you set States when enabling to
held, the output y1 is as follows.
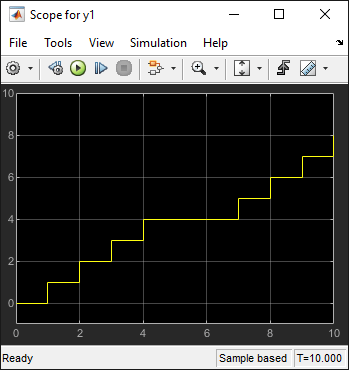
When state A1 becomes inactive at t = 5, the Simulink function holds the counter value. When A1 is active again at t = 7, the
counter has the same value as it did at t = 5. Therefore, the output y1
continues to increment over time.
Function Behavior When Variables Are Reset
If you set States when enabling to
reset, the output y1 is as follows.
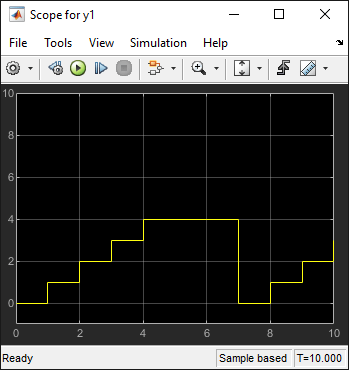
When state A1 becomes inactive at t = 5, the Simulink function does not hold the counter value. When A1 is
active again at t = 7, the counter resets to zero. Therefore, the output
y1 resets too.