Use Moore Charts to Model the Karplus-Strong Algorithm
This example shows how to use Stateflow charts with Moore semantics to model the Karplus-Strong string synthesis algorithm. The Karplus-Strong string synthesis algorithm to simulate the sound made by a plucked string, such a from a guitar or a banjo. For more information, see Design Considerations for Moore Charts.
Moore charts produce outputs that depend only on the current state. Since the outputs of the charts are in a feedback loop, this example uses Moore semantics to avoid algebraic loops.
Examine Model
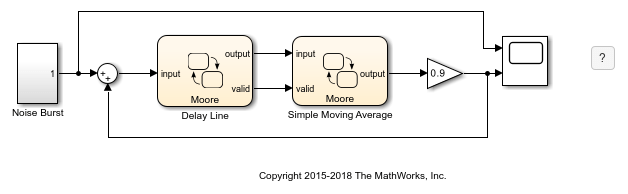
The sf_karplus_strong model contains two Moore charts, Delay Line and Simple Moving Average. It also contains a Simulink subsystem, Noise Burst .
The Noise Burst subsystem uses a Uniform Random Number block to generate an initial burst of white noise. The subsystem outputs this signal to the Delay Line chart.
On each cycle through the delay line, a moving average filter smooths the signal, and adds a gain factor of less than 1. These two elements model the natural losses in string vibration over time, causing the initial sharp attack to decay gradually.
Enable Feedback Loops with Moore Chart Semantics
Since this model includes an algebraic loop, the charts must compute the outputs solely from the current state. The Delay Line and Simple Moving Average charts use Moore semantics, which use only the current state, not the inputs or next state, to calculate the output. For more information about algebraic loops, see Algebraic Loop Concepts (Simulink).
Mealy or classic charts include direct feedthrough from inputs to outputs. Placing these chart types in this feedback loop create an algebraic loop error during simulation, unless an external unit delay block breaks the loop.
Examine the Circular Buffer in the Delay Line Chart
The Delay Line chart implements the delay line by using three states and a graphical function. The Init state initializes the output and buffer index. The UnderDelayValues state stores the input at the current index and updates the index using the next_index graphical function. The ShiftWindow state outputs the delayed sample from the buffer at the next index position.
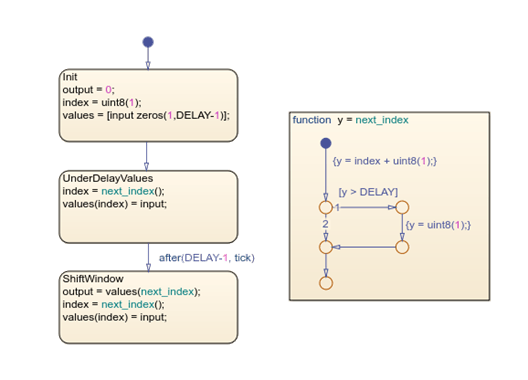
The UnderDelayValues state applies circular buffering, where the chart writes the new input and increments the index. The ShiftWindow state reads the delayed sample, introduces a one-sample delay, and closes the feedback loop.
The constant data, DELAY, determines the maximum delay length and the lowest synthesizable frequency. You can change the pitch range of the output signal by changing the DELAY data to different values.
Examine the Tone Shaping in the Simple Moving Average Chart
The Simple Moving Average chart models a filter that shapes the tone in the Karplus-Strong algorithm. The chart contains two parallel states, PropagateAverageToOutput and ComputeAverage.
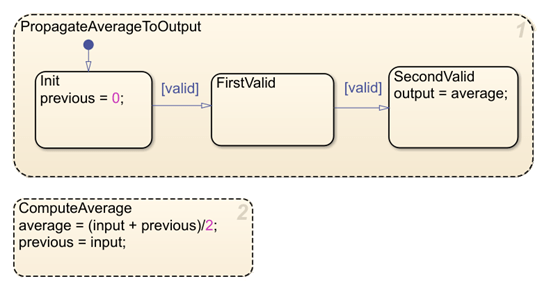
The PropagateAverageToOutput state has three child states, Init, FirstValid, and SecondValid. The Init state initializes the previous input value to 0. The SecondValid state outputs the average value.
The ComputeAverage state calculates the average of the current and previous input samples and outputs the result. This average reduces the harshness of the raw delayed signal.
You can adjust the filter length by modifying the number of samples in the average calculation. A longer filter length produces more aggressive-sounding, darker timbre, and a shorter length produces a brighter sound.
Simulate the Model and Examine the Results
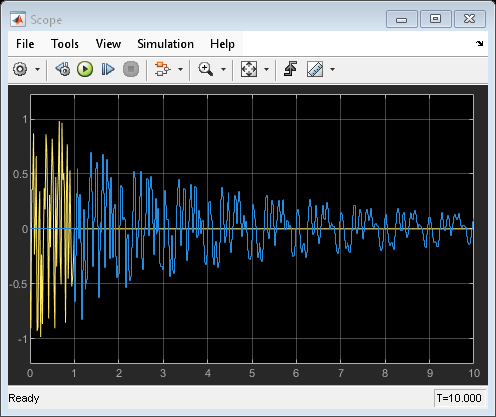
Simulate the model, then open the Scope block. The Scope block shows the output audio wave. The initial noise burst creates a sharp attack, which then gradually decays over time.