Create a Mask to Share Parameters with Simulink
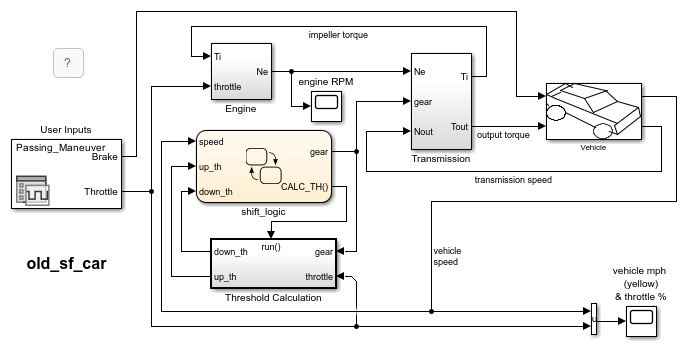
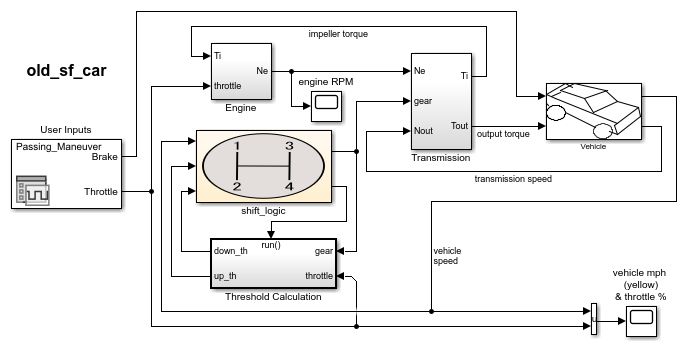
Creating masks for Stateflow® charts, state transition tables, and truth tables simplifies how you use and share blocks in a Simulink® model. A mask is a custom interface for a Chart, State Transition Table, and Truth Table blocks that hides the block content, making it appear as an atomic block:
Changing the appearance with meaningful icons and ports.
Creating a user interface for parameters.
Adding customized documentation.
You decide which parameters to change through the mask user interface. You can
provide meaningful descriptions of these parameters. For example, in the model
sf_car, the shift_logic chart has a mask through which
you can adjust the parameter TWAIT. To open the model, enter:
openExample("sf_car")To open the Mask Parameters dialog box, double-click the Stateflow chart. This dialog box contains a parameter description "Delay before
gear change (tick)" and a box to edit the value. This value is tied to the
parameter TWAIT inside the mask. When you edit the value in this box,
Stateflow assigns the new value to TWAIT during simulation.

You can create other types of user interfaces for the mask parameters, such as check boxes, context menus, and option buttons.
You can create masks on Stateflow blocks accessible from the Simulink library: charts, state transition tables, and truth tables. You cannot mask states or any other objects within a chart.
For more information, see Author Block Masks (Simulink).
Create a Mask for a Stateflow Chart
To create a mask for the Stateflow chart in the model old_sf_car:
Open the model.
openExample("old_sf_car")
In the Simulink Editor, select the chart
shift_logic.Open the Mask Editor. In the State Chart tab, click Create Mask.
Add an Icon to the Mask
To customize the appearance of the block icon, use drawing commands or load an image. For more information, see Mask Display and Initialization Commands (Simulink).
In the Mask Editor, select the Icon tab.
In the toolstrip, click Graphical and select Drawing Commands.
In the edit box, enter:
image("shift_logic.svg")Click Save Mask.
Add Parameters to the Mask
When you create a mask for a Stateflow block, you can define a custom interface for the block parameters. You provide access to the block parameters by defining corresponding parameters with the same name in the Mask Editor. A user interface to these parameters is then provided through a Mask Parameters dialog box. The mask parameters appear as editable fields in the Mask Parameters dialog box. Stateflow applies these values to the corresponding block parameters during simulation.
For example, the chart shift_logic has a parameter
TWAIT. To add TWAIT as a parameter to the mask:
In the Mask Editor, select the Parameters & Dialog tab.
In the Controls pane, under Parameter, click the Edit icon.
Under Prompt, enter the prompt for the new mask parameter in the Mask Parameters dialog box:
Delay before gear change(tick)
Under Name, enter the name of the parameter in the mask:
TWAIT
Click Save Mask.
View the New Mask
After creating a mask, the new icon for the shift_logic chart appears
in the Simulink canvas. If you double-click the icon, the Mask Parameters dialog box opens.
This dialog box has the prompt for the parameter TWAIT. The value in the
edit box is assigned to the parameter TWAIT during simulation.

Look Under the Mask
You can view and edit the contents of a masked block by clicking the Look inside mask badge on the chart. The badge is a downward facing arrow in the lower-left corner of the chart. Alternatively, in the State Chart tab, click Look Under Mask. Looking under a mask does not unmask the block.
Edit the Mask
To edit a mask, in the State Chart tab, click Edit Mask. In the Mask Editor, you can modify the mask icon, change the parameters, or add documentation. To remove the mask, click Unmask in the lower corner of the Mask Editor. After you change a mask, click Apply to save the changes.