View Stateflow States in the Logic Analyzer
Use the Logic Analyzer (DSP System Toolbox) to visualize and measure transitions and states over time. With the Logic Analyzer, you can visualize:
Output data from your chart
Child and leaf state activity for your chart
Self, child, and leaf state activity for your states
You can measure the output over time and add triggers to identify the output values at specified events.
Note
To use the Logic Analyzer, you must have DSP System Toolbox™, SoC Blockset™, or HDL Verifier™.
Add Signals and States for Logging
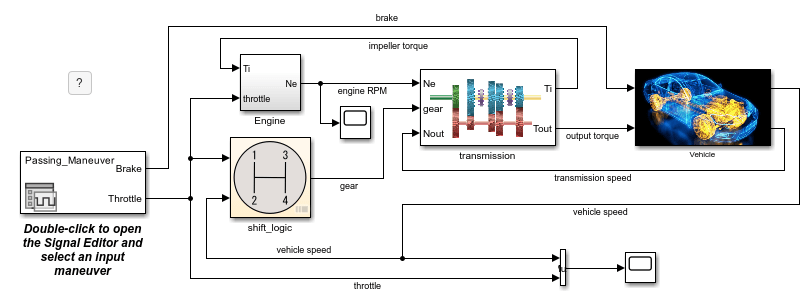
In this example, you use the Logic Analyzer to visualize the behavior of the
engine RPM, the transmission and vehicle speed, and the gear state in the model
sf_car.
Open the model
sf_car.openExample("sf_car")
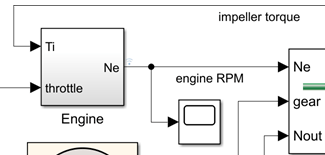
In the Simulink® Editor, click the
engine RPMsignal. Then, in the Simulation tab, select Log Signals.
The logging badge
 appears above the signal to indicate that
the data from the signal is logged when you run the model.
appears above the signal to indicate that
the data from the signal is logged when you run the model.Repeat the previous step for the
transmission speedandvehicle speedsignals.Open the
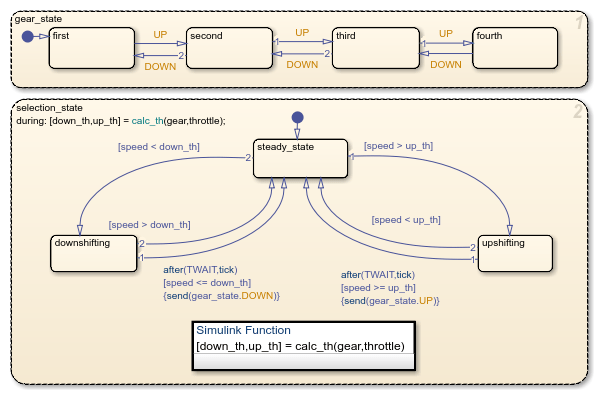
shift_logicchart by clicking the arrow in the bottom-left corner of the block.
Select the state
gear_state. Then, in the Simulation tab, click Log Child Activity. The logging badge appears in the corner of the
state.
View Logged Output in Logic Analyzer
Simulate the model.
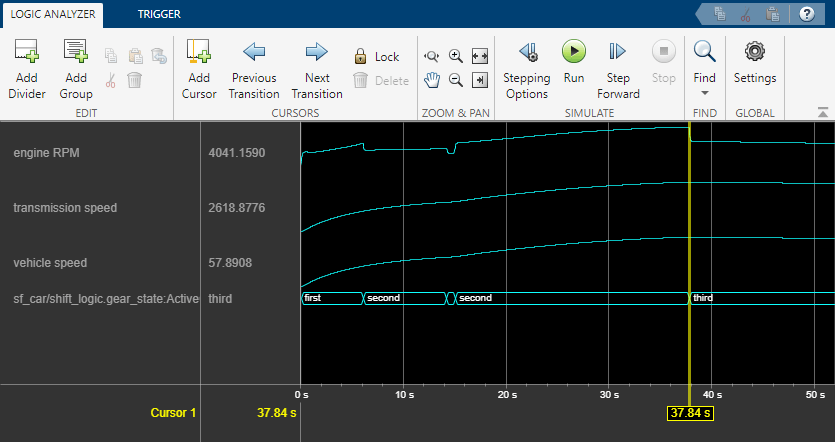
In the Simulation tab, under Review Results, select Logic Analyzer
 . When you simulate the model, the icon is
highlighted to indicate that the Logic Analyzer has new
simulation data.
. When you simulate the model, the icon is
highlighted to indicate that the Logic Analyzer has new
simulation data.In the Logic Analyzer window, drag the yellow cursor to see the signal values at different points in the simulation. For example, you can see the reaction of the engine RPM as the car gears change. For more information, see Inspect and Measure Transitions Using the Logic Analyzer (DSP System Toolbox).

See Also
Logic Analyzer (DSP System Toolbox)
