taylor
泰勒级数
说明
示例
求指数函数、正弦函数和余弦函数的麦克劳林级数展开(展开至五阶)。
syms x
T1 = taylor(exp(x))
T1 =
T2 = taylor(sin(x))
T2 =
T3 = taylor(cos(x))
T3 =
您可以使用 sympref 函数来修改符号多项式的输出顺序。按升序重新显示多项式。
sympref("PolynomialDisplayStyle","ascend");
T1
T1 =
T2
T2 =
T3
T3 =
使用 sympref 设置的显示格式会在当前和以后的 MATLAB® 会话中持续有效。通过指定 "default" 选项恢复默认值。
sympref("default");求这些函数在 处的泰勒级数展开。默认展开点为 0。要指定其他展开点,请使用 ExpansionPoint。
syms x
T = taylor(log(x),x,ExpansionPoint=1)
T =
或者,将展开点指定为 taylor 的第三个参量。
T = taylor(acot(x),x,1)
T =
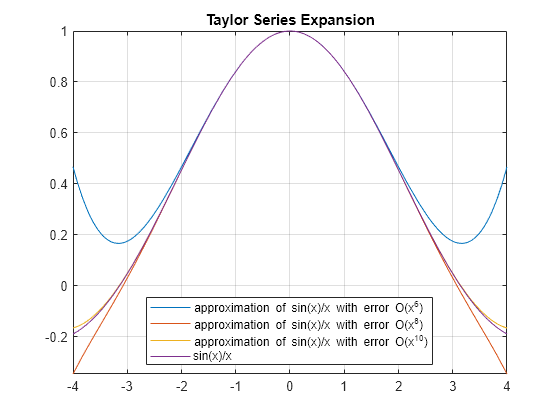
求 f = sin(x)/x 的麦克劳林级数展开。默认截断阶数为 6。此表达式的泰勒级数逼近没有五次项,因此 taylor 使用四次多项式逼近此表达式。
syms x
f = sin(x)/x;
T6 = taylor(f,x);
使用 Order 控制截断阶数。例如,用 7 阶和 9 阶逼近该同一表达式。
T8 = taylor(f,x,Order=8);
T10 = taylor(f,x,Order=10);
绘制原始表达式 f 及其逼近 T6、T8 和 T10。注意逼近的准确度如何依赖于截断阶数。
fplot([T6 T8 T10 f])
xlim([-4 4])
grid on
legend("approximation of sin(x)/x with error O(x^6)", ...
       "approximation of sin(x)/x with error O(x^8)", ...
       "approximation of sin(x)/x with error O(x^{10})", ...
       "sin(x)/x",Location="Best")
title("Taylor Series Expansion")
求以下表达式的泰勒级数展开。默认情况下,taylor 使用绝对阶数,即计算所得级数的截断阶数。
syms x
T = taylor(1/exp(x) - exp(x) + 2*x,x,Order=5)
T =
使用 OrderMode 求具有相对截断阶数的泰勒级数展开。对于某些表达式,相对截断阶数可提供更准确的逼近。
T = taylor(1/exp(x) - exp(x) + 2*x,x,Order=5,OrderMode="relative")T =
求以下多元表达式的麦克劳林级数展开。如果您不指定变量向量,taylor 会将 f 视为包含一个自变量的函数。
syms x y z
f = sin(x) + cos(y) + exp(z);
T = taylor(f)
T =
通过指定变量向量来求多元麦克劳林级数展开。
syms x y z
f = sin(x) + cos(y) + exp(z);
T = taylor(f,[x,y,z])
T =
您可以使用 sympref 函数来修改符号多项式的输出顺序。按升序重新显示多项式。
sympref("PolynomialDisplayStyle","ascend");
T
T =
使用 sympref 设置的显示格式会在当前和以后的 MATLAB 会话中持续有效。通过指定 "default" 选项恢复默认值。
sympref("default");通过同时指定变量向量和定义展开点的值向量,求多元泰勒级数展开。
syms x y
f = y*exp(x - 1) - x*log(y);
T = taylor(f,[x y],[1 1],Order=3)
T =
如果您将展开点指定为标量 a,taylor 会将该标量转换为与变量向量长度相同的向量。展开向量的所有元素都等于 a。
T = taylor(f,[x y],1,Order=3)
T =
求在使用泰勒级数展开逼近函数 时的误差估计。此处,假设计算在展开点 处的 7 阶泰勒逼近(截断阶数 )。
泰勒逼近的误差(余项)由拉格朗日形式给出:
误差估计的上界可通过求正实数 来计算,使得所有介于 和 之间的 均满足 。
通过将 Order 指定为 8,求函数 的 7 阶泰勒级数展开。
syms x
f = log(x+1)
f =
T = taylor(f,Order=8)
T =
为了估计泰勒逼近中的误差,首先计算项 。
syms c
fn(c) = subs(diff(f,8),x,c)
fn(c) =
对于正的 值,可以通过使用关系 来计算误差估计的上界(因为 必须是介于 和正数 之间的正值)。然后,使用拉格朗日形式 和关系 求误差估计的上界 Rupper(x)。
Rupper(x) = 5040*x^8/factorial(8)
Rupper(x) =
计算点 处的泰勒级数展开。求泰勒逼近中误差估计的上界。
Teval = subs(T,x,0.5)
Teval =
Rmax = double(Rupper(0.5))
Rmax =
4.8828e-04
为进行比较,计算 处的精确函数值,并求泰勒逼近中的余项。
feval = subs(f,x,0.5)
feval =
R = double(abs(feval-Teval))
R =
3.3846e-04
输入参数
名称-值参数
详细信息
提示
版本历史记录
在 R2006a 之前推出