Transform Spherical Coordinates to Cartesian Coordinates and Plot Analytically
This example shows how to transform a symbolic expression from spherical coordinates to Cartesian coordinates, and plot the converted expression analytically without explicitly generating numerical data.
In the spherical coordinate system, the location of a point can be characterized by three variables. Different textbooks have different conventions for the variables used to describe spherical coordinates. For these examples, this convention is used:
The radial distance
The azimuthal angle
The polar angle
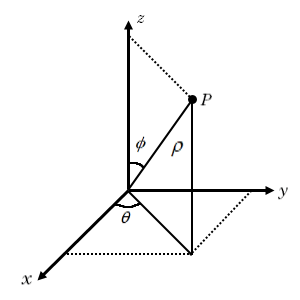
The transformation of the point from spherical coordinates to Cartesian coordinates is given by
By transforming symbolic expressions from spherical coordinates to Cartesian coordinates, you can then plot the expressions using Symbolic Math Toolbox™ graphics functions, such as fplot3 and fsurf.
Plot a Point and Its Projections
Plot the point that is located at .
Transform the spherical coordinates to Cartesian coordinates . Because the converted coordinates contain numerical values, use plot3 to plot the point.
rho = 1;
theta = 1.2;
phi = 0.75;
x_P = rho*sin(phi)*cos(theta);
y_P = rho*sin(phi)*sin(theta);
z_P = rho*cos(phi);
plot3(x_P,y_P,z_P,'ko','MarkerSize',10,'MarkerFaceColor','k')
hold on
Label each axis in the plot, change the line of sight, and set the axis scaling to use equal data units.
xlabel('x')
ylabel('y')
zlabel('z')
view([75 40])
axis equal;
Next, plot the line projection of the point to the origin. This line projection in spherical coordinates is parameterized by , with ranging from to . Specify this line parameterization as symbolic expressions, and plot it by using fplot3.
syms r
xr = r*sin(phi)*cos(theta);
yr = r*sin(phi)*sin(theta);
zr = r*cos(phi);
fplot3(xr,yr,zr,[0 rho],'k')
Plot the vertical line projection to the -plane. This line projection in Cartesian coordinates is parameterized by , with ranging from to .
syms z
fplot3(sym(x_P),sym(y_P),z,[0 z_P],'k')
Plot the top horizontal line projection to the -axis. This line projection in Cartesian coordinates is parameterized by , with ranging from to .
fplot3(xr,yr,sym(z_P),[0 rho],'k--')Plot the bottom horizontal line projection to the -axis. This line projection in Cartesian coordinates is parameterized by , with ranging from to .
fplot3(xr,yr,sym(0),[0 rho],'k')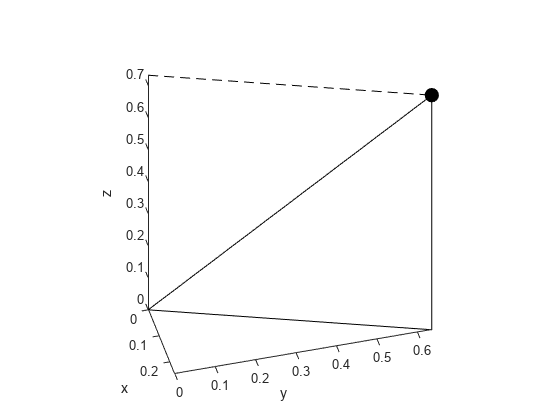
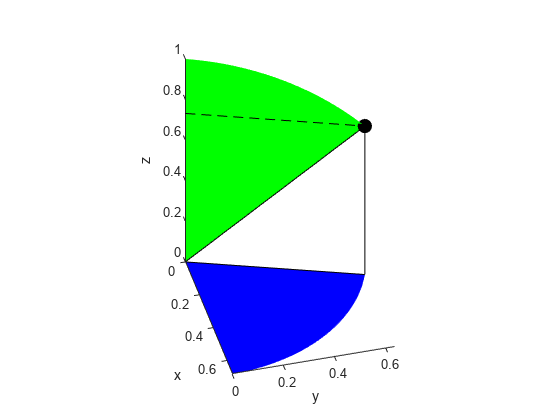
Next, plot the plane that shows the span of the azimuthal angle in the -plane with the coordinate .
syms s t
x_azimuthal = s*sin(phi)*cos(t);
y_azimuthal = s*sin(phi)*sin(t);
fsurf(x_azimuthal,y_azimuthal,0,[0 rho 0 theta],'FaceColor','b','EdgeColor','none')
Plot the plane that shows the span of the polar angle .
syms u v
x_polar = u*sin(v)*cos(theta);
y_polar = u*sin(v)*sin(theta);
z_polar = u*cos(v);
fsurf(x_polar,y_polar,z_polar,[0 rho 0 phi],'FaceColor','g','EdgeColor','none')
hold off
Plot a Sphere
Plot a sphere with radius .
In spherical coordinates, the sphere is parameterized by , with ranging from to and ranging from to . Transform spherical coordinates to Cartesian coordinates by specifying the surface parameterization as symbolic expressions. Then plot the sphere by using fsurf.
syms phi theta
r = 4;
x = r*sin(phi)*cos(theta);
y = r*sin(phi)*sin(theta);
z = r*cos(phi);
fsurf(x,y,z,[0 pi 0 2*pi])
axis equal

Plot a Half Sphere
Plot a half sphere with radius .
In spherical coordinates, the sphere is parameterized by , with ranging from to and ranging from to . Transform spherical coordinates to Cartesian coordinates by specifying the surface parameterization as symbolic expressions. Then plot the half sphere by using fsurf.
syms phi theta
r = 4;
x = r*sin(phi)*cos(theta);
y = r*sin(phi)*sin(theta);
z = r*cos(phi);
fsurf(x,y,z,[0 pi/2 0 2*pi])
axis equal

Plot a Parameterized Surface
Plot a parameterized surface whose radial distance in spherical coordinates is related to the azimuthal and polar angles.
The surface has radial coordinates , with ranging from to and ranging from to . Transform spherical coordinates to Cartesian coordinates by specifying the surface parameterization as symbolic expressions. Then plot the parameterized surface by using fsurf.
syms phi theta
rho = 2 + sin(5*phi + 7*theta);
x = rho*sin(phi)*cos(theta);
y = rho*sin(phi)*sin(theta);
z = rho*cos(phi);
fsurf(x,y,z,[0 pi 0 2*pi])
view(45,50)
