图形
MATLAB® 提供了许多绘制数值数据的方法。Symbolic Math Toolbox™ 通过提供符号表达式、方程和函数的绘图函数扩展了这些图形功能。这些绘图可以用二维或三维的线条、等高线、曲面或网格形式呈现。您可以在笛卡尔坐标或极坐标中创建绘图。您还可以创建动画绘图。
函数
属性
主题
- Create Plots of Symbolic Expressions
Plot symbolic expressions, including parametric or implicit expressions, in 2-D or 3-D as line, contour, or surface plots.
- Transform Spherical Coordinates to Cartesian Coordinates and Plot Analytically
Transform symbolic expressions from spherical to Cartesian coordinates, and plot analytically.
- Tangent Plane and Normal Line of Implicit Surface
Find tangent plane and normal line of implicitly defined surface.
精选示例
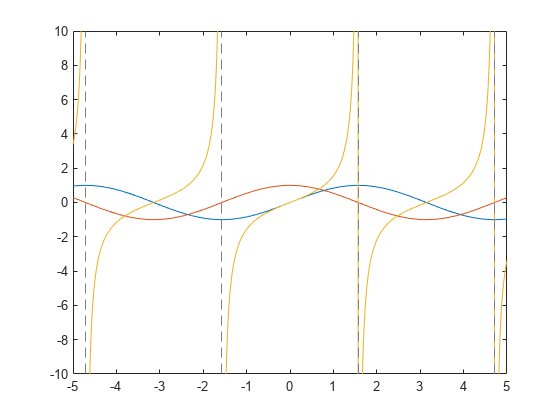
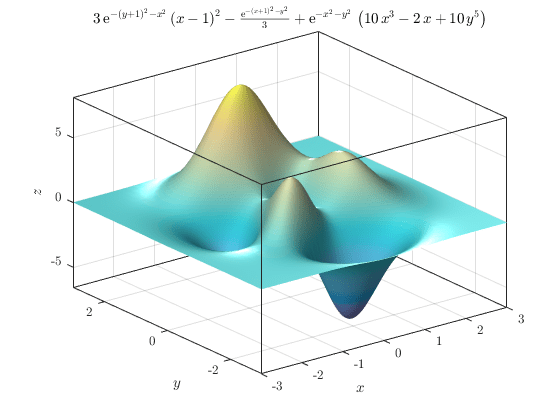
使用 Symbolic Math Toolbox 进行解析绘图
Symbolic Math Toolbox 提供数学表达式的解析绘图,而无需显式生成数值数据。
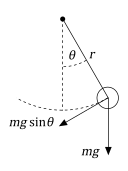
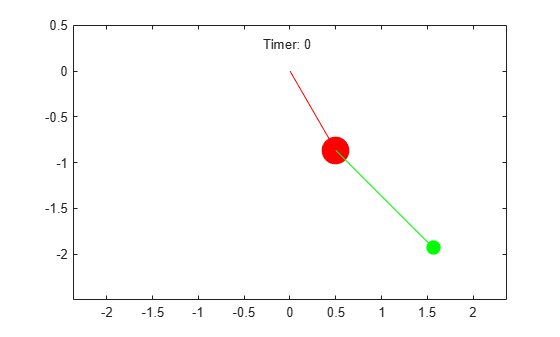
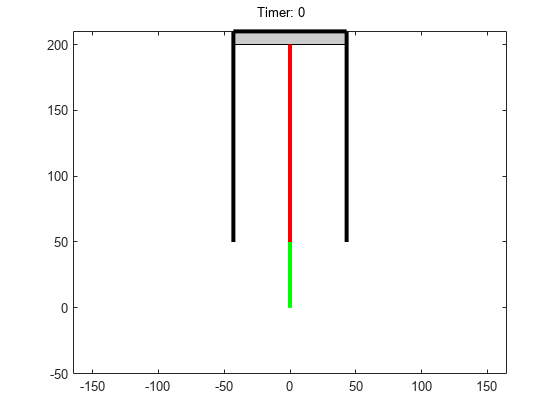
Simulate the Motion of the Periodic Swing of a Pendulum
Solve the equation of motion of a simple pendulum analytically for small angles and numerically for any angle.
Animation and Solution of Double Pendulum Motion
Model the motion of a double pendulum by using MATLAB® and Symbolic Math Toolbox™.
Animation and Model of Automotive Piston
Model the motion of an automotive piston by using MATLAB and Symbolic Math Toolbox.