在词云中可视化词频
此示例显示如何使用词云中的 Text Analytics Toolbox™ 直观地显示文本的分布。使用 ThingSpeak™ 对文本进行排序,看看哪些参数影响分布或情绪。
CheerLights 允许世界各地的人们通过社交媒体界面同步到一个设定的颜色。ThingSpeak 通道 1417 存储 CheerLights 颜色的历史记录。从 ThingSpeak 通道读取单词并比较早期和晚期时间戳的分布。
读取文本数据并计算词频
从 CheerLights ThingSpeak 通道读取最后 500 个数据点。使用 Text Analytics Toolbox 中的 bagofwords 函数查找集合中每个文档中单词的频率。
colorData = thingSpeakRead(1417,'numPoints',500,'OutputFormat','Timetable','fields', [1]);
bagOfWords(colorData.LastCheerLightsCommand')
ans =

  bagOfWords with properties:

          Counts: [61 68 40 59 23 42 52 59 40 46 10]
      Vocabulary: [1×11 string]
        NumWords: 11
    NumDocuments: 1
按时间排序结果
找到每个时间戳早于午餐时间的数据点的索引,然后找到所有午餐时间之后的数据点的索引。使用索引为每种情况创建一个包含所有单词的数组。
lateTimeIndex = (hour(colorData.Timestamps) > 12);
earlyTimeIndex = (hour(colorData.Timestamps) < 12);

lateColors = colorData.LastCheerLightsCommand(lateTimeIndex);
earlyColors = colorData.LastCheerLightsCommand(earlyTimeIndex);
比较词云中的词频
使用排序后的数据生成词云。subplot 函数允许您并排比较它们。
subplot(1,2,1);
earlyWordCloud = wordcloud(earlyColors,'Color','blue')
title('Early Morning CheerLights');

subplot(1,2,2);
lateWordCloud = wordcloud(lateColors,'color','green')
title('Late Night CheerLights');
earlyWordCloud =

  WordCloudChart with properties:

           WordData: [1×11 string]
           SizeData: [67 60 58 58 49 46 42 40 40 22 10]
    MaxDisplayWords: 100

  Use GET to show all properties


lateWordCloud =

  WordCloudChart with properties:

           WordData: ["cyan"    "magenta"    "red"    "white"]
           SizeData: [1 1 1 1]
    MaxDisplayWords: 100

  Use GET to show all properties
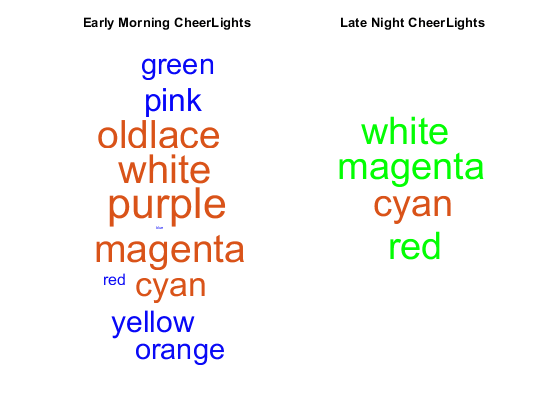
发送到 CheerLights 的颜色分布似乎仅仅大致取决于发布的时间。有些颜色只在下午很强烈,而有些颜色全天都很强烈。
另请参阅
Get Started with Text Analytics Toolbox (Text Analytics Toolbox) | wordcloud (Text Analytics Toolbox)