Code Verification and Validation with Processor-in-the-Loop (PIL) Simulation
This example shows you how to use UAV Toolbox™ Support Package for PX4™ Autopilots for code verification and validation with Processor-in-the-Loop (PIL).
In this example, you will learn how to configure a Simulink® model to run Processor-in-the-Loop (PIL) simulations. In a PIL simulation, the generated code runs on PX4 flight controllers. The results of the PIL simulation are transferred to Simulink to verify the numerical equivalence of the simulation and the code generation results. The PIL verification process is a crucial part of the development cycle to ensure that the behavior of the deployment code matches the design.
For more details about PIL, refer to SIL and PIL Simulations (Embedded Coder).
This example introduces the Simulink code generation and verification workflow by showing you how to configure a Simulink model to run PIL simulations on the PX4 flight controllers. This example is pre-configured to run on Pixhawk® 6x board. You can configure this model for other supported PX4 flight controllers by selecting the "Hardware board" on the Hardware Implementation pane of the Configuration Parameters dialog box.
Required Hardware
To run this example you will need the following hardware:
Supported PX4 flight controller board
USB type A to Mini-B cable
Choosing a Communication Interface for PIL Simulation
The PX4 flight controller supports interface that does not require any additional cables or hardware besides a USB type A to Mini-B cable that is used to connect the flight controller to the host computer that runs UAV Toolbox Support Package for PX4 Autopilots.
1. Open the px4demo_top_model_pil model.
2. Open the Modeling tab and click Model Settings to open Configuration Parameters dialog box.
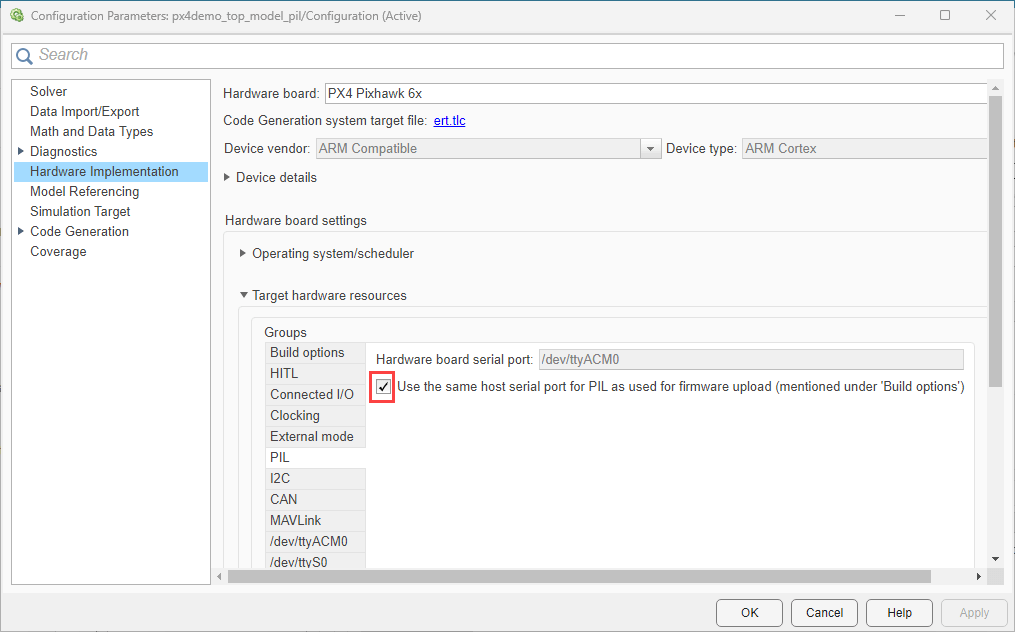
3. Go to Hardware Implementation > Target Hardware Resources > PIL.
PIL can be run only on the USB (/dev/ttyACM0) port of the hardware. By default PIL uses the same host serial port used for firmware upload. To manually specify the host serial port, clear the checkbox and specify the port value.

Tip: You can use the Device Manager to identify the COM port of the host computer to which the PX4 flight controller is connected.
Verifying Top Model Code with PIL
This example shows how to verify the generated code for a model by running a PIL simulation. With this approach:
You can verify code generated for a top model
You must configure the model to load test vectors or stimulus inputs from the MATLAB® workspace
You can easily switch the entire model between normal and PIL simulation mode
1. Open the px4demo_top_model_pil model.
This model is configured for the PX4 Pixhawk 6x target. You can run the model for other PX4 Autopilot targets, by changing the Hardware board to the supported PX4 flight controller in the Configuration Parameters > Hardware Implementation pane.
2. Choose PIL communication interfaces by following the steps in Choosing a Communication Interface for PIL Simulation section above.
3. In the Simulink model window, go to Apps tab and search SIL/PIL Manager.
4. Select Processor-in-the-Loop(PIL) from the SIL/PIL Mode drop-down and click Run Verification.

5. When the PIL simulation is completed, a logsOut variable is created in the base workspace. The logsOut data contains PIL simulation results. You can access the logged data for signals count_a and count_b by using the following commands:
a. count_a = get(logsOut,'count_a');
count_a.Values.Data
b. count_b = get(logsOut,'count_b');
count_b.Values.Data
Verifying Referenced Model Code with PIL
This example shows how to verify the generated code for a referenced model by running a PIL simulation. With this approach:
You can verify code generated for referenced models
You must provide a test harness model to provide a test vector or stimulus inputs
You can easily switch a Model block between normal and PIL simulation mode
1. Open the px4demo_model_ref_pil model.
This model is configured for PX4 Pixhawk 6x target. You can run the model for other PX4 targets, by changing the Hardware board to supported PX4 flight controllers in the Configuration Parameters > Hardware Implementation pane.
The model contains two Model blocks (CounterA and CounterB) that both point at the same referenced model. Note that the Hardware board change has to be made in the reference model also (right-click CounterA or CounterB block, and select Open as Top Model), by following the steps above. You will configure one of the Model blocks to run in PIL simulation mode and the other in normal mode.
2. Choose a PIL communication interface by following the steps in Choosing a Communication Interface for PIL Simulation section above.
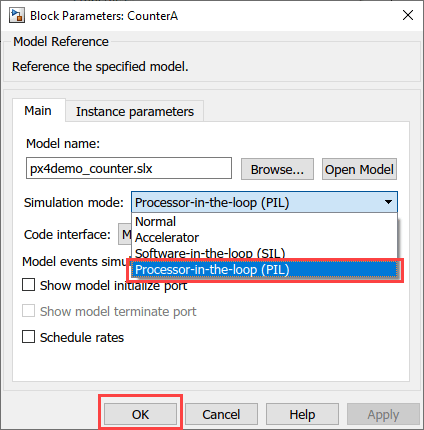
3. Configure and run CounterA Model block in PIL simulation mode by following steps below:
a. Right click on block CounterA and select Block Parameters (ModelReference)

b. In the CounterA block parameter, select Simulation mode as Processor-in-the-Loop(PIL), and click OK.

c. Go to Simulation tab and click Run.
4. When the model starts running, Scope1 displays the PIL simulation output running on the PX4 Autopilot while Scope2 shows the normal mode simulation output.
Verifying the Generated Code for a Subsystem Using a PIL Block
This example shows how to use a PIL block for subsystem code verification. With this approach:
You can verify the code generated for a subsystem
You must provide a test harness model to supply a test vector or stimulus inputs
You must swap your original subsystem with a generated PIL block; you should be careful to avoid saving your model in this state as you would lose your original subsystem.
1. Open the px4demo_pil_block model.
This model is configured for the PX4 Pixhawk 6x target. You can run the model for other PX4 targets, by changing the Hardware board to supported PX4 flight controller in the Configuration Parameters > Hardware Implementation pane.
The objective here is to create a PIL block out of the Controller subsystem that you will run on the PX4 flight controller.
2. Choose a PIL communication interface by following the steps in Choosing a Communication Interface for PIL Simulation section above.
3. Enable PIL by following these steps:
a. Go to the Modeling tab and click Model Settings to open Configuration Parameters dialog box.
b Go to Code Generation > Verification > Advanced parameters and select PIL.

4. Create a PIL block for the Controller subsystem by following these steps:
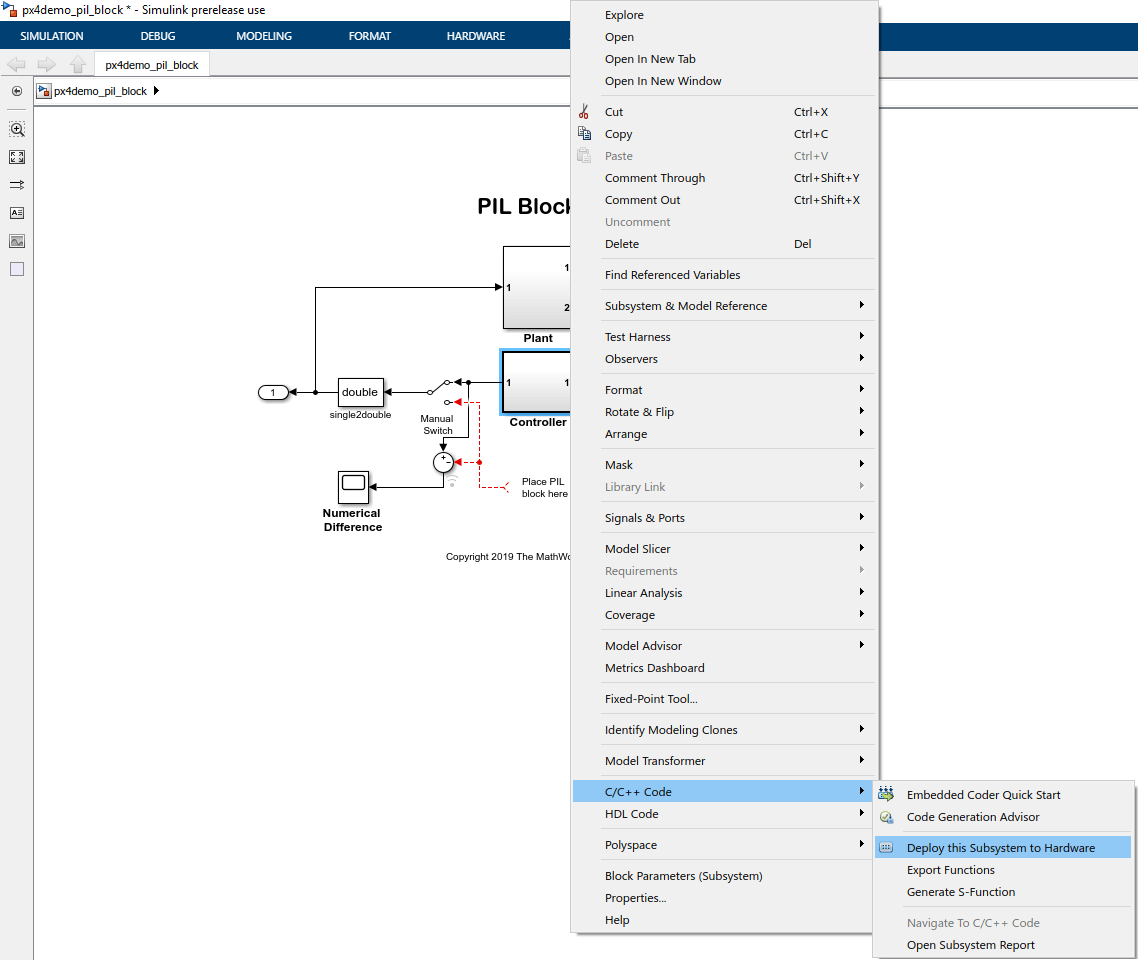
a. Right click on the Controller subsystem and select Deploy this Subsystem to Hardware.

b. In the Build code for SubsystemController dialog box, click Build.

5. Run PIL simulation by following below steps:
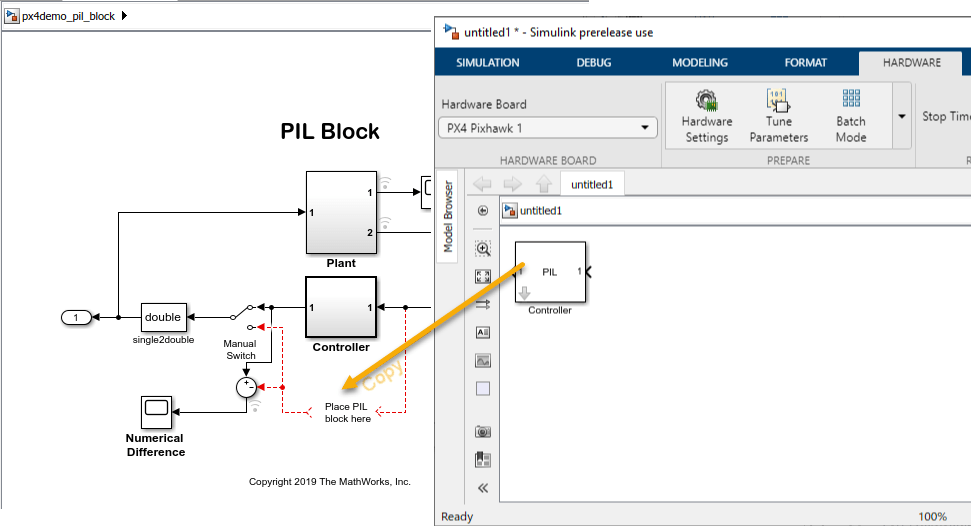
a. Copy the PIL Subsystem block to your model.
b. Go to the Simulation tab, and click Run.

6. The generated executable is copied to the board.
7. You can switch between the original and PIL block subsystems by double clicking on the Manual Switch block. Double click on the Numerical Differences block to see the difference between the simulated Controller subsystem and the PIL block running on the Pixhawk Series controller hardware board.
Perform Code Profiling with PIL
You can perform code profiling while verifying code using PIL. Code profiling helps you to check whether the generated code meets real-time performance requirements. You can identify the tasks that require the most time and then investigate whether a tradeoff between functionality and speed is possible.
You can enable code profiling along with PIL simulation by using SIL/PIL Manager App (which enables basic code profiling) or by using the Configuration Parameters dialog box (which provides advanced options for code profiling).
Note: The execution time profiling depends on the clocking frequency that is configured for the selected hardware board. In the Configuration Parameters dialog box, go to Hardware Implementation > Target hardware resources > Clocking to view the clocking frequency.
Enable Code Profiling from SIL/PIL Manager App
1. After you open the Simulink model, go to Apps tab and select SIL/PIL Manager.
2. In the SIL/PIL tab, select Processor-in-the-Loop(PIL) from the SIL/PIL Mode drop-down list.
3. Go to Settings and select Task Profiling. Selecting this option enables the execution time profiling of the model.

Enable Code Profiling from Configuration Parameters Dialog Box
1. After you open the Simulink model, go to the Modeling tab and click Model Settings to open Configuration Parameters dialog box.
2 Go to Code Generation > Verification > Advanced parameters and select PIL.
3 To profile the execution time for each rate in the model, select Measure task execution time.
The next parameter Measure function execution times is set to Off, by default. You can set this parameter to Coarse (referenced models and subsystems only) or to Detailed (all function call sites). Additionally, set the Save options to All data. Verify that the name of the Workspace variable is executionProfile. Click Apply and then OK.

Complete the PIL simulation by following the required steps (as mentioned in the previous sections).
After the PIL simulation is completed, the executionProfile variable appears in the MATLAB workspace. Obtain the profiling report and analyze different turnaround and execution times:
report(executionProfile)