imageMetrics
Syntax
Description
imageSummary = imageMetrics(metrics)metrics, for each image in
the data set.
[
evaluates the object detection metrics, imageSummary,imagePredictions,imageGroundTruth] = imageMetrics(metrics)metrics, for each image in
the data set, and returns the performance summary, predictions, and ground truth
information for each image.
[___] = imageMetrics(
evaluates the object detection metrics, metrics,imageIndices)metrics, for images in the
data set specified using the image indices, imageIndices.
[___] = imageMetrics(___,
specifies options that configure per-image metrics using name-value arguments, in
addition to the input arguments from the previous syntaxes. For example,
Name=Value)ClassNames=["person" "car"] specifies to evaluate per-image
metrics for the person and car classes.
Examples
Load Detection Results and Ground Truth Annotations
Load precomputed detection results and ground truth labels. The ground truth data is a subset of the Indoor Object Detection Dataset created by Bishwo Adhikari, and is in the form of a boxLabelDatastore that returns the object bounding boxes and their corresponding class labels for every image [1]. The MAT files containing the precomputed results and annotations are attached to this example as supporting files. To train an object detector on a custom dataset and generate the detection results, see Multiclass Object Detection Using YOLO v2 Deep Learning.
load("yolov2IndoorObjectDetectorAnnotation100.mat");
load("yolov2IndoorObjectDetectorResults100.mat");
Evaluate and Summarize Object Detection Metrics
Evaluate the object detection results against the ground truth using the evaluateObjectDetection function. Compute the metrics summary across the dataset and classes using the summarize function.
evalMetrics = evaluateObjectDetection(results,blds,[0.5,0.75,0.9]);
[summaryDataset,summaryClass] = summarize(evalMetrics);
disp(summaryDataset)
    NumObjects    mAPOverlapAvg    mAP0.5     mAP0.75     mAP0.9
    __________    _____________    _______    _______    ________

       171           0.40012       0.74165    0.44671    0.012002
disp(summaryClass)
                        NumObjects    APOverlapAvg     AP0.5     AP0.75       AP0.9
                        __________    ____________    _______    _______    __________

    exit                    53          0.60733        0.9619    0.82106      0.039027
    fireextinguisher        49          0.54426       0.93878    0.68903     0.0049712
    chair                   55          0.35992       0.88449    0.19463    0.00062696
    clock                   13           0.4891       0.92308    0.52885      0.015385
    trashbin                 1                0             0          0             0
    screen                   0              NaN           NaN        NaN           NaN
    printer                  0              NaN           NaN        NaN           NaN
The summary across classes shows that the "trashbin" class has only one ground truth object in this evaluation dataset, while the "screen" and "printer" classes do not have any ground truth objects present.
Evaluate Per-Image Metrics
Compute per-image metrics for the data set.
imageSummary = imageMetrics(evalMetrics);
Display the first ten images and their summarized per-image metrics.
disp(imageSummary(1:10,:) )
    ImageIndex    NumPredictedObjects    NumGroundTruthObjects    TP    FP    FN    Precision    Recall
    __________    ___________________    _____________________    __    __    __    _________    _______

         1                 2                       2              2     0     0            1           1
         2                 2                       2              2     0     0            1           1
         3                 1                       1              1     0     0            1           1
         4                 0                       2              0     0     2          NaN           0
         5                 3                       2              2     1     0      0.66667           1
         6                 2                       3              2     0     1            1     0.66667
         7                 2                       2              2     0     0            1           1
         8                 2                       2              2     0     0            1           1
         9                 2                       2              2     0     0            1           1
        10                 3                       2              2     1     0      0.66667           1
Plot the histogram of false positive (FP) and false negative (FN) counts for each image.
figure;
subplot(1,2,1)
histogram(imageSummary.FP)
xlabel("False Positives Per Image")
ylabel("Frequency")
grid on
subplot(1,2,2)
histogram(imageSummary.FN)
xlabel("False Negatives Per Image")
ylabel("Frequency")
grid on
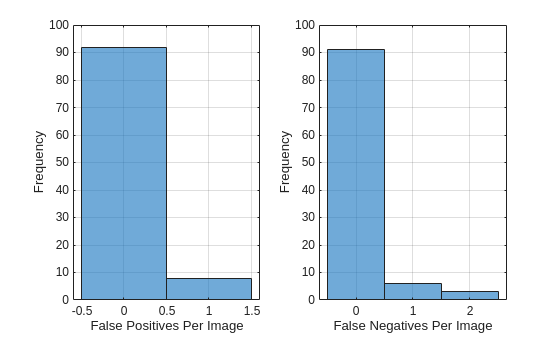
Most images have very few mistakes. The FP histogram shows that 8 images have one false positive detection. The FN histogram shows that 6 images have one false negative, and only 3 images have two false negatives.
[1] Adhikari, Bishwo; Peltomaki, Jukka; Huttunen, Heikki. (2019). Indoor Object Detection Dataset [Data set]. 7th European Workshop on Visual Information Processing 2018 (EUVIP), Tampere, Finland.
Load precomputed detection results and ground truth labels. The ground truth data is a subset of the Indoor Object Detection Dataset created by Bishwo Adhikari [1]. The MAT files containing the precomputed results and annotations are attached to this example as supporting files.
load("yolov2IndoorObjectDetectorAnnotation100.mat");
load("yolov2IndoorObjectDetectorResults100.mat");
Evaluate Object Detection Results
Evaluate the object detection results against the ground truth using the evaluateObjectDetection function. Specify three overlap thresholds for the evaluation: 0.5, 0.75, and 0.9.
evalMetrics = evaluateObjectDetection(results,blds,[0.5 0.75 0.9]);
Analyze Detector Performance Across Object Size and Class
Compute per-image metrics for the data set.
[imageSummary,imagePredictions,imageGroundTruths] = imageMetrics(evalMetrics);
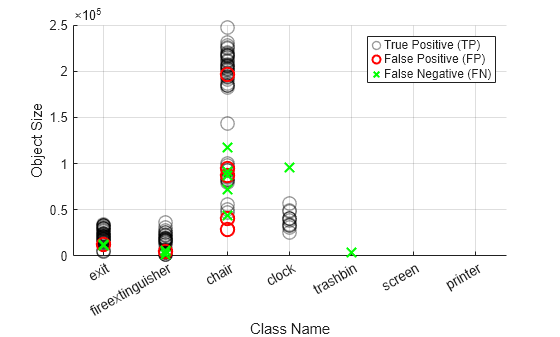
To analyze object size- and class-based detector performance, create a visual representation of the number of true positives, false positives, false negatives for the entire data set. First, concatenate all prediction tables from all images into a single table tblPreds.
tblPreds = vertcat(imagePredictions{:});Create a logical array indicating which predictions are matched to ground truth objects, or are true positives (TPs).
isMatchedPred = logical(tblPreds.IsMatched);
Extract true positives (TPs) by keeping only the Label (class name) and Area (object size) columns for rows where predictions are matched to ground truth.
tp = tblPreds(isMatchedPred,["Label" "Area"]);
Extract false positives (FPs) by keeping only the Label (class name) and Area (object size) columns for rows where predictions are not matched to ground truth.
fp = tblPreds(~isMatchedPred,["Label" "Area"]);
Concatenate all ground truth tables into tblTruths, and create a logical array indicating which ground truths were matched by predictions. Extract false negatives (FNs) by keeping only Label and Area for ground truths not matched to any prediction.
tblTruths = vertcat(imageGroundTruths{:});
isMatchedGT = logical(tblTruths.IsMatched);
fn = tblTruths(~isMatchedGT,["Label" "Area"]);
Plot TPs as black circles using a swarm chart, with class name on the x-axis and object size on the y-axis. Plot false positives as red circles. Plot false negatives as green 'x' markers.
figure;
swarmchart(tp.Label,tp.Area,[],"k",XJitter="none",...
    LineWidth=1,SizeData=100,MarkerEdgeAlpha=0.4,DisplayName="True Positive (TP)")
hold on
swarmchart(fp.Label,fp.Area,[],"r",XJitter="none",...
    LineWidth=1.5,SizeData=100,DisplayName="False Positive (FP)")
swarmchart(fn.Label,fn.Area,[],"gx",XJitter="none",...
    LineWidth=1.5,SizeData=100,DisplayName="False Negative (FN)")
hold off
ylabel("Object Size")
xlabel("Class Name")
grid on
legend()
[1] Adhikari, Bishwo; Peltomaki, Jukka; Huttunen, Heikki. (2019). Indoor Object Detection Dataset [Data set]. 7th European Workshop on Visual Information Processing 2018 (EUVIP), Tampere, Finland.
Load precomputed detection results and ground truth labels. The ground truth data is a subset of the Indoor Object Detection Dataset created by Bishwo Adhikari [1]. The MAT files containing the precomputed results and annotations are attached to this example as supporting files.
load("yolov2IndoorObjectDetectorAnnotation100.mat");
load("yolov2IndoorObjectDetectorResults100.mat");
Evaluate Object Detection Results
Evaluate the object detection results against the ground truth using the evaluateObjectDetection function. Specify three overlap thresholds for the evaluation: 0.5, 0.75, and 0.9.
evalMetrics = evaluateObjectDetection(results,blds,[0.5 0.75 0.9]);
Compute Per-Image Metrics for Subset of Images
Compute the per-image metrics for a subset of images, and display the results.
imageResultsSubset = imageMetrics(evalMetrics,1:2:10);
disp(imageResultsSubset)
    ImageIndex    NumPredictedObjects    NumGroundTruthObjects    TP    FP    FN    Precision    Recall
    __________    ___________________    _____________________    __    __    __    _________    ______

        1                  2                       2              2     0     0            1       1
        3                  1                       1              1     0     0            1       1
        5                  3                       2              2     1     0      0.66667       1
        7                  2                       2              2     0     0            1       1
        9                  2                       2              2     0     0            1       1
Compute Image Metrics at Specific Score Threshold
Specify a higher score threshold using the ScoreThreshold name-value argument, and compute the per-image metrics. At a higher score threshold, low confidence score predictions are dropped, leading to which will lead to fewer detected objects and more misses, or false negatives (FNs):
imageResultsThresh = imageMetrics(evalMetrics,1:2:10,ScoreThreshold=0.7);
disp(imageResultsThresh)
    ImageIndex    NumPredictedObjects    NumGroundTruthObjects    TP    FP    FN    Precision    Recall
    __________    ___________________    _____________________    __    __    __    _________    ______

        1                  2                       2              2     0     0         1           1
        3                  1                       1              1     0     0         1           1
        5                  1                       2              1     0     1         1         0.5
        7                  1                       2              1     0     1         1         0.5
        9                  1                       2              1     0     1         1         0.5
Compute Image Metrics at Specific Overlap Threshold
Specify a higher overlap threshold using the OverlapThreshold name-value argument, and compute the per-image metrics. The OverlapThreshold value must be one of the overlap thresholds at which the detection results were evaluated using the evaluateObjectDetection function.
imageResultsThresh = imageMetrics(evalMetrics,1:2:10,ScoreThreshold=0.7,OverlapThreshold=0.75);
disp(imageResultsThresh)
    ImageIndex    NumPredictedObjects    NumGroundTruthObjects    TP    FP    FN    Precision    Recall
    __________    ___________________    _____________________    __    __    __    _________    ______

        1                  2                       2              2     0     0         1           1
        3                  1                       1              1     0     0         1           1
        5                  1                       2              0     1     2         0           0
        7                  1                       2              1     0     1         1         0.5
        9                  1                       2              1     0     1         1         0.5
When you specify a higher overlap threshold, the detector misses more detections (more FNs).
[1] Adhikari, Bishwo; Peltomaki, Jukka; Huttunen, Heikki. (2019). Indoor Object Detection Dataset [Data set]. 7th European Workshop on Visual Information Processing 2018 (EUVIP), Tampere, Finland.
Load precomputed detection results and ground truth labels. The ground truth data is a subset of the Indoor Object Detection Dataset created by Bishwo Adhikari [1]. The MAT files containing the precomputed results and annotations are attached to this example as supporting files.
load("yolov2IndoorObjectDetectorAnnotation100.mat");
load("yolov2IndoorObjectDetectorResults100.mat");
Evaluate Object Detection Results
Evaluate the object detection results against the ground truth using the evaluateObjectDetection function. Specify three overlap thresholds for the evaluation: 0.5, 0.75, and 0.9.
evalMetrics = evaluateObjectDetection(results,blds,[0.5 0.75 0.9]);
Identify Challenging Images Across All Classes
To identify images where the object detector performs poorly across all classes, analyze per-image detector performance using the false positive (FP) and false negative (FN) counts. First, compute the per-image metrics.
[summaryError,predsError,truthsError] = imageMetrics(evalMetrics,SortMetric="FP+FN",SortOrder="descend");
Select the 20 images with the highest number of incorrect detections, or the total number of FNs and FPs.
summaryError = summaryError(1:20,:);
predsError = predsError(1:20);
truthsError = truthsError(1:20);
Display the computed per-image metrics for the five images with the most incorrect detections.
disp(summaryError(1:5,:))
    ImageIndex    NumPredictedObjects    NumGroundTruthObjects    TP    FP    FN    Precision    Recall
    __________    ___________________    _____________________    __    __    __    _________    _______

         4                 0                       2              0     0     2          NaN           0
        39                 4                       4              3     1     1         0.75        0.75
        66                 0                       2              0     0     2          NaN           0
        82                 1                       3              1     0     2            1     0.33333
         5                 3                       2              2     1     0      0.66667           1
Display the object predictions for the image with the index 39. The third "chair" class detection for this image is a FP, with its IsMatched column field set to false.
disp(predsError{2}) ImageIndex Label Score OverlapScore IsMatched MatchedTruthLabel MatchedTruthIndex Area BoundingBox
__________ _____ _______ ____________ _________ _________________ _________________ _____ ____________________________
39 chair 0.87222 0.74144 true chair 2 85352 468 61 227 376
39 chair 0.86277 0.70789 true chair 1 98304 656 74 256 384
39 chair 0.66098 0 false <undefined> 0 28470 1018 1 146 195
39 chair 0.62006 0.67055 true chair 4 55566 317 71 189 294
Identify Challenging Images for Specific Class
To identify images which are challenging for the object detector in detecting a specified class, analyze per-image detector performance using the FP and FN counts. To identify images where the detector struggled to identify objects of the "exit" class, specify the ClassNames name-value argument as "exit".
[summaryErrorClass,predsErrorClass,truthsErrorClass] = imageMetrics(evalMetrics,ClassNames="exit",OverlapThreshold=0.75,...
    SortMetric="FP+FN",SortOrder="descend");
Select the 20 images with the highest number of incorrect detections, or the total number of FNs and FPs.
summaryErrorClass = summaryErrorClass(1:20,:);
predsErrorClass = predsErrorClass(1:20);
truthsErrorClass = truthsErrorClass(1:20,:);
Display the computed per-image metrics for the five images with the most incorrect detections.
disp(summaryErrorClass(1:5,:))
    ImageIndex    NumPredictedObjects    NumGroundTruthObjects    TP    FP    FN    Precision    Recall
    __________    ___________________    _____________________    __    __    __    _________    ______

        20                 1                       1              0     1     1          0          0
        26                 1                       1              0     1     1          0          0
        47                 2                       2              1     1     1        0.5        0.5
        55                 2                       2              1     1     1        0.5        0.5
       100                 1                       1              0     1     1          0          0
Display the object predictions for the image with the image index 47, which has one FP and one FN. The second "exit" class detection for this image is a FP, with its IsMatched column field set to false.
disp(predsErrorClass{3}) ImageIndex Label Score OverlapScore IsMatched MatchedTruthLabel MatchedTruthIndex Area BoundingBox
__________ _____ _______ ____________ _________ _________________ _________________ _____ ________________________
47 exit 0.90114 0.91124 true exit 1 19902 464 221 186 107
47 exit 0.68702 0.67807 false <undefined> 0 29346 785 295 219 134
Display the ground truth information for the image. The second ground truth row for this image indicates a FN, with its IsMatched column field set to false.
disp(truthsErrorClass{3}) ImageIndex Label IsMatched Area BoundingBox
__________ _____ _________ _____ ________________________
47 exit true 19890 463 221 195 102
47 exit false 27032 746 305 248 109
[1] Adhikari, Bishwo; Peltomaki, Jukka; Huttunen, Heikki. (2019). Indoor Object Detection Dataset [Data set]. 7th European Workshop on Visual Information Processing 2018 (EUVIP), Tampere, Finland.
Load precomputed detection results and ground truth labels. The ground truth data is a subset of the Indoor Object Detection Dataset created by Bishwo Adhikari [1]. The MAT files containing the precomputed results and annotations are attached to this example as supporting files.
load("yolov2IndoorObjectDetectorAnnotation100.mat");
load("yolov2IndoorObjectDetectorResults100.mat");
Evaluate Object Detection Results
Evaluate the object detection results against the ground truth using the evaluateObjectDetection function. Specify three overlap thresholds for the evaluation: 0.5, 0.75, and 0.9.
evalMetrics = evaluateObjectDetection(results,blds,[0.5 0.75 0.9]);
Compute F1 Score Per Image
The F1 score is the harmonic mean of precision and recall, providing a balanced measure of classification performance. An F1 score of 1 indicates perfect precision and recall, while 0 indicates the worst performance.
Compute the image metrics over the data set.
[summaryError,predsError,truthsError] = imageMetrics(evalMetrics);
Display the first five rows of the per-image summary.
disp(summaryError(1:5,:))
    ImageIndex    NumPredictedObjects    NumGroundTruthObjects    TP    FP    FN    Precision    Recall
    __________    ___________________    _____________________    __    __    __    _________    ______

        1                  2                       2              2     0     0            1       1
        2                  2                       2              2     0     0            1       1
        3                  1                       1              1     0     0            1       1
        4                  0                       2              0     0     2          NaN       0
        5                  3                       2              2     1     0      0.66667       1
Note that precision is the ratio of the number of true positives and the total number of predicted positives. The value of precision on the 4th row is NaN, since there are no predictions on this particular image, leading to a division by zero in the ratio calculation. Recall is the ratio of the number of true positives and the number of ground truth objects in that image. The value of recall for this image is zero, since no objects are detected, while there are two ground truth objects actually present in the image.
Compute the F1 score over the data set using the precision and recall values from the summaryError table.
precision = summaryError.Precision;
recall = summaryError.Recall;
f1Score = 2 * (precision .* recall) ./ (precision + recall);
Organize the precision, recall and F1 score values into a table.
prfTable = table(precision, recall, f1Score, VariableNames={'Precision', 'Recall', 'F1 Score'});Display the precision, recall, and F1 score values for the first five images.
disp(prfTable(1:5,:))
    Precision    Recall    F1 Score
    _________    ______    ________

           1       1           1
           1       1           1
           1       1           1
         NaN       0         NaN
     0.66667       1         0.8
[1] Adhikari, Bishwo; Peltomaki, Jukka; Huttunen, Heikki. (2019). Indoor Object Detection Dataset [Data set]. 7th European Workshop on Visual Information Processing 2018 (EUVIP), Tampere, Finland.
Input Arguments
Name-Value Arguments
Output Arguments
Version History
Introduced in R2026a