extractpatches
R2026bDescription
Examples
Load an image containing objects to count into the workspace.
I = imread("coins.png");Display the image using the imageshow function.
hImage = imageshow(I);
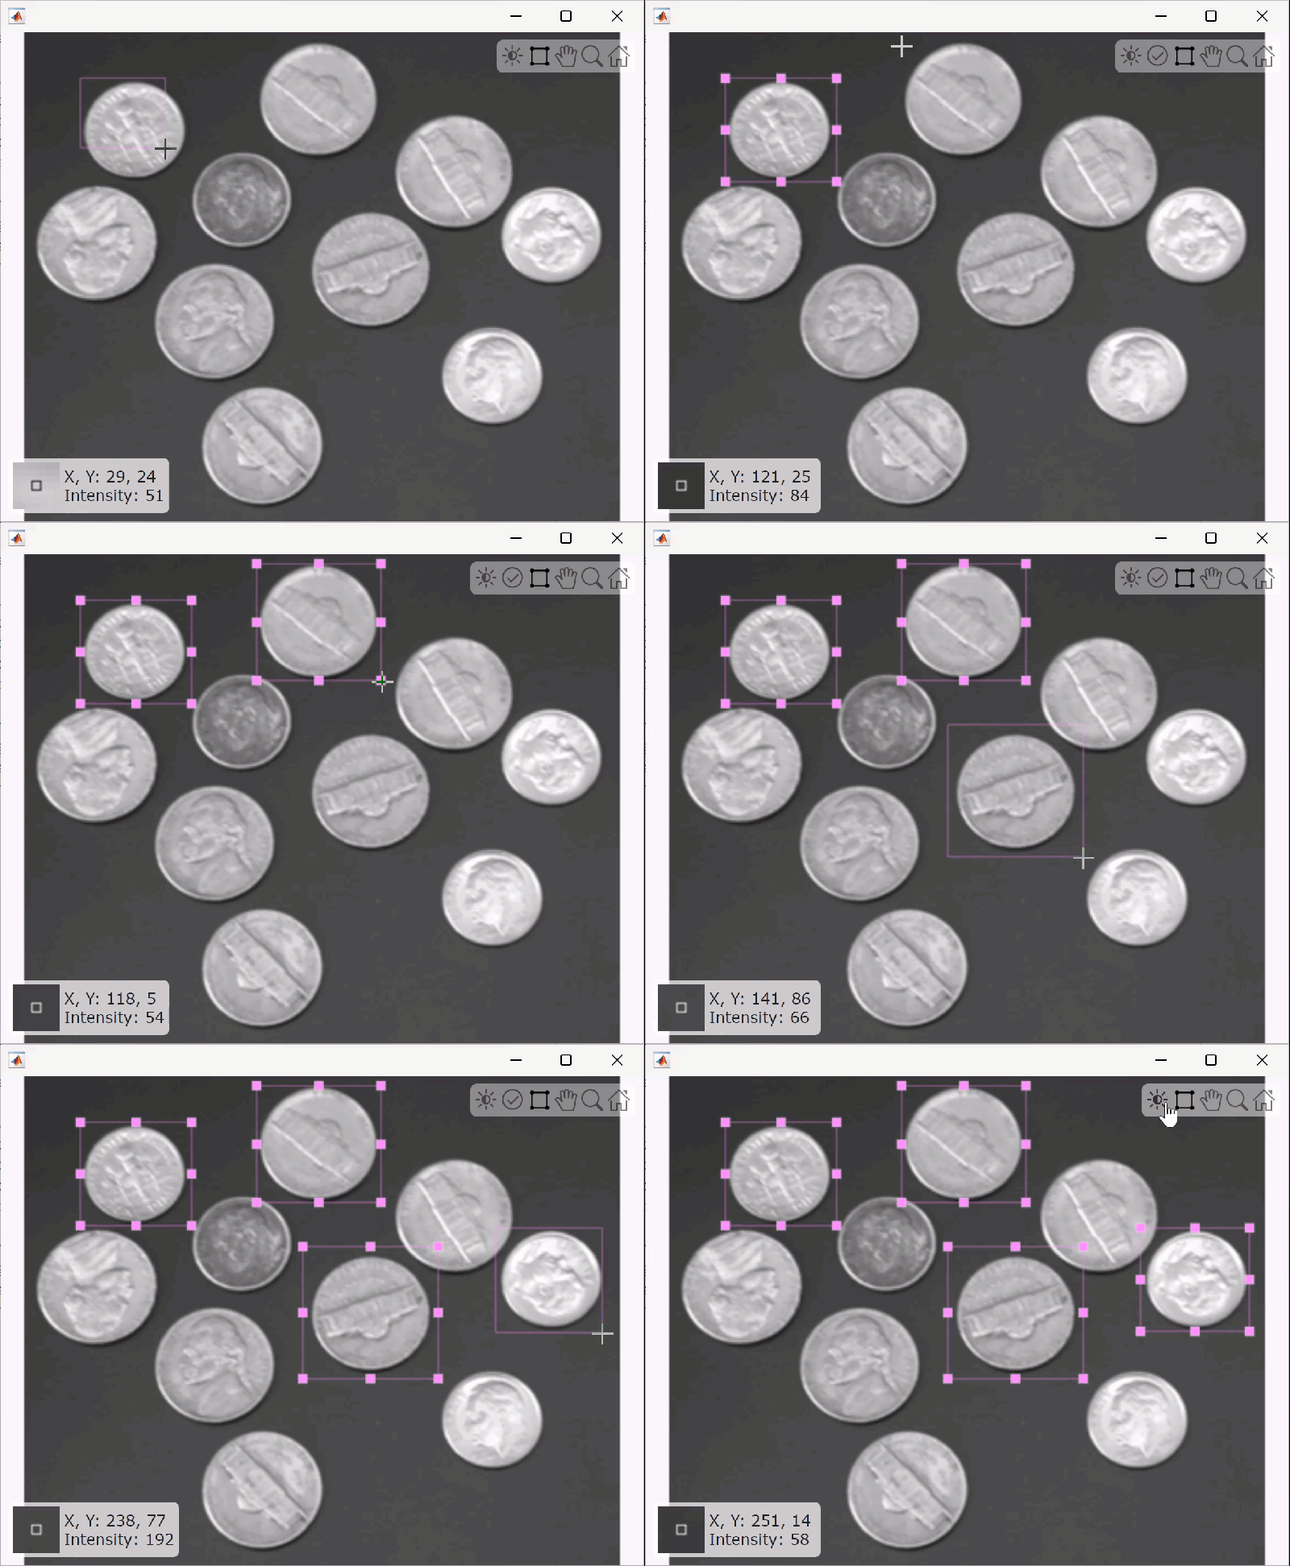
To interactively define bounding box ROIs on the image, use the uiselectboxes function. Click a start point in the image and drag boxes around the desired objects. Click Accept in the top-right corner of the figure window when you are satisfied with your selections.
bboxes = uiselectboxes(hImage)
bboxes = 4×4
195.4484 28.4718 69.5974 63.5455
321.0263 101.0952 55.9805 58.2500
224.9516 116.2251 65.0584 61.2760
165.1886 85.9653 55.2240 52.1980
This GIF shows how to interactively select bounding boxes by creating and dragging the boxes to different positions on the image.
Extract the patch tiles from the image using the extractpatches function.
tiles = extractpatches(I,bboxes)
tiles = 4×1 cell array
64×70 uint8
58×56 uint8
62×65 uint8
52×55 uint8
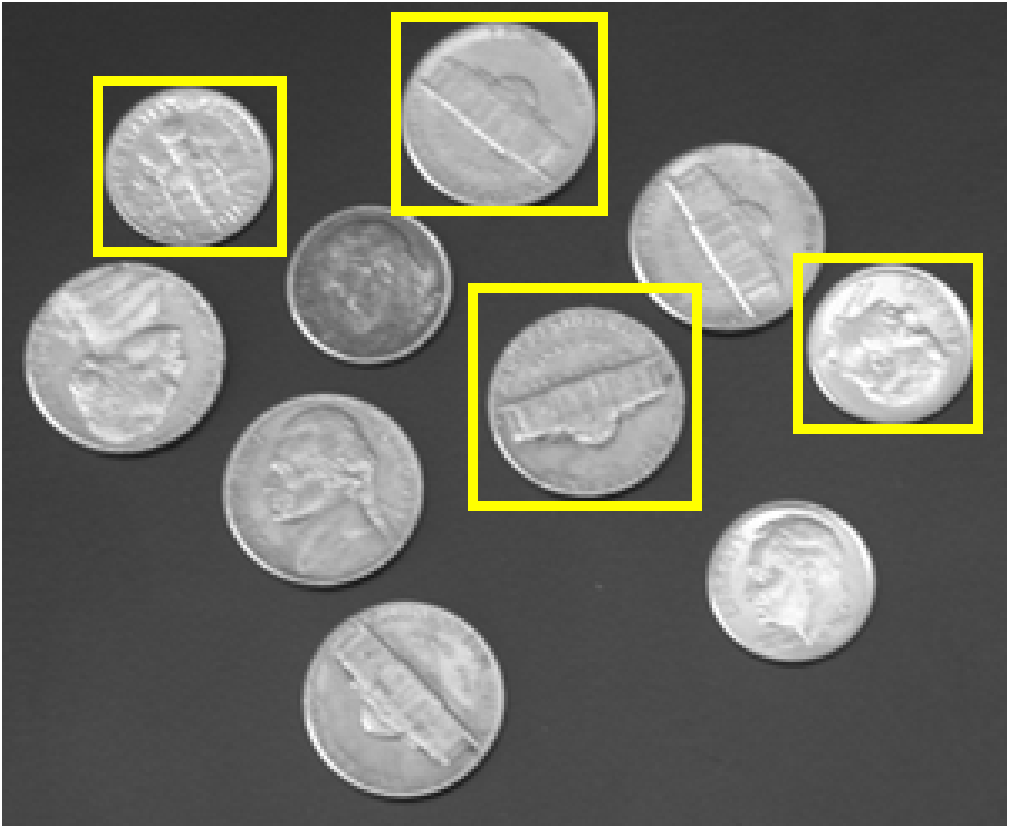
Display the bounding boxes defining the image patches overlaid on the image using the insertShape function.
annotatedImage = insertShape(I,"rectangle",bboxes,"LineWidth",3); imshow(annotatedImage)
Input Arguments
Input image from which to extract patches, specified as one of these options:
| Image Type | Data Format |
|---|---|
| Grayscale | H-by-W numeric matrix |
| RGB | H-by-W-by-3 numeric array |
Axis-aligned rectangular bounding box ROIs that enclose patches, specified as an M-by-4 numeric matrix. M is the number of bounding box ROIs. Each row of the matrix represents a bounding box, and is of the form [x y w h], where:
x and
yspecify the upper-left corner of the rectangle.w specifies the width of the rectangle, which is its length along the x-axis.
h specifies the height of the rectangle, which is its length along the y-axis.
You can interactively select bounding box ROIs for an image using the uiselectboxes function.
Output Arguments
Image patches, returned as an M-by-1 cell array.
M is the number of bounding box ROIs specified using the
bboxes name-value argument. Each element of the array is
an image patch, returned as one of these values depending on the format of the
input image I.
RGB — Each patch is a P-by-Q-by-3 numeric array.
Grayscale — Each patch is a P-by-Q numeric matrix.
P and Q are the height and width dimensions of each patch, respectively.
Extended Capabilities
C/C++ Code Generation
Generate C and C++ code using MATLAB® Coder™.
GPU Code Generation
Generate CUDA® code for NVIDIA® GPUs using GPU Coder™.
Version History
Introduced in R2026aStarting in R2026b, extractpatches is available
in the Visual Inspection
Toolbox™ product. In releases R2026a and before, extractpatches is available
in the Automated Visual Inspection Library for Computer Vision Toolbox™ add-on.
See Also
MATLAB Command
You clicked a link that corresponds to this MATLAB command:
Run the command by entering it in the MATLAB Command Window. Web browsers do not support MATLAB commands.
选择网站
选择网站以获取翻译的可用内容,以及查看当地活动和优惠。根据您的位置,我们建议您选择:。
您也可以从以下列表中选择网站:
如何获得最佳网站性能
选择中国网站(中文或英文)以获得最佳网站性能。其他 MathWorks 国家/地区网站并未针对您所在位置的访问进行优化。
美洲
- América Latina (Español)
- Canada (English)
- United States (English)
欧洲
- Belgium (English)
- Denmark (English)
- Deutschland (Deutsch)
- España (Español)
- Finland (English)
- France (Français)
- Ireland (English)
- Italia (Italiano)
- Luxembourg (English)
- Netherlands (English)
- Norway (English)
- Österreich (Deutsch)
- Portugal (English)
- Sweden (English)
- Switzerland
- United Kingdom (English)