wpviewcf
Plot wavelet packets colored coefficients
Description
Examples
Create a wavelet packet tree using the Haar wavelet.
Fs = 200;
x = 0:1/Fs:1;
y = sin(8*pi*x);
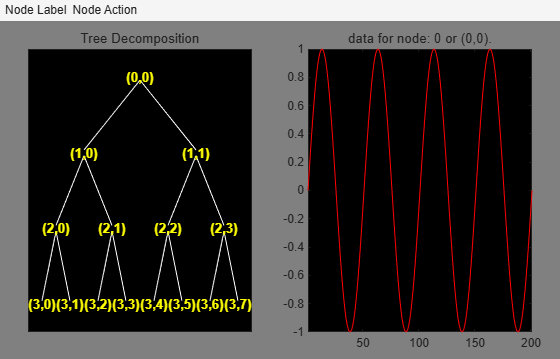
t = wpdec(y,3,"haar");Use plot, the plot tree GUI, to plot the tree.
plot(t)
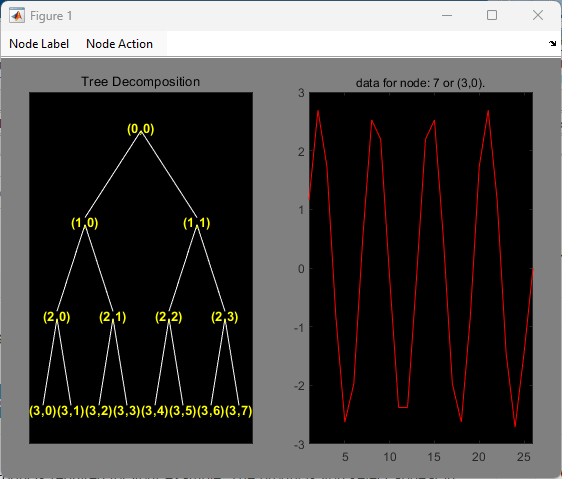
Click the node (3,0) to get this figure:
Plot the colored wavelet packet coefficients.
wpviewcf(t,1)

Input Arguments
Version History
Introduced before R2006a