wirelessNetworkViewer
Description
Use the wirelessNetworkViewer object to view wireless networks.
Creation
Syntax
Description
networkViewer = wirelessNetworkViewer
networkViewer = wirelessNetworkViewer(PropertyName=Value)RefreshRate=5 sets the refresh rate for the viewer to
5.
Properties
Object Functions
addNodes | Add wireless nodes to wireless network viewer |
removeNodes | Remove nodes from wireless network viewer |
showBoundary | Create and visualize node placement boundary on canvas |
hideBoundary | Remove placement boundaries from canvas |
Examples
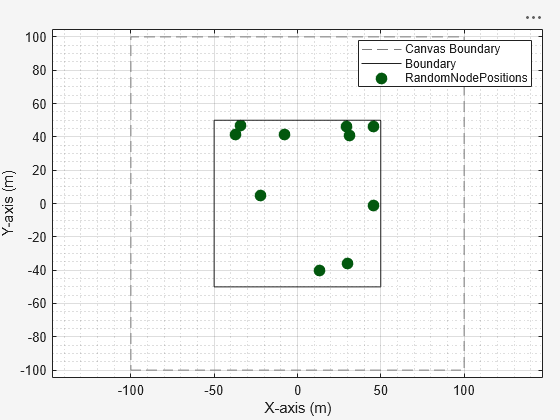
Generate and visualize the random placement of wireless nodes within a rectangular area. Using the nodePositionRandom function, you distribute ten nodes uniformly inside a 100-by-100 meter region. Then, a wirelessNetworkViewer object displays the resulting node positions.
Set the area dimensions and number of nodes.
areaLength = 100;           % Rectangle length (meters)
areaWidth = 100;            % Rectangle width (meters)
numNodes = 10;              % Number of random nodes
Generate random node positions in the rectangle.
[nodePositions,rectPoly] = nodePositionRandom( ...
    "rectangle",[areaLength areaWidth],NumNodes=numNodes);
View the positions using the wireless network viewer.
viewer = wirelessNetworkViewer(CanvasSize=[200 200]);
addNodes(viewer,nodePositions,Type="RandomNodePositions")
Show the rectangle boundary.
showBoundary(viewer, ...
    Position=[0 0 0], ...
    BoundaryShape="rectangle", ...
    Bounds=[areaLength areaWidth], ...
    Name="RectangleBoundary")
Remove the node position by uncommenting this line of code.
% removeNodes(viewer)Hide the rectangle boundary by uncommenting this line of code.
% hideBoundary(viewer)Version History
Introduced in R2026a