WLAN Waveform Analyzer
Description
The WLAN Waveform Analyzer app enables you to blindly detect, decode, analyze an IEEE 802.11a™, IEEE 802.11n™, IEEE 802.11ac™, IEEE 802.11ax™, or IEEE® 802.11be™ packet in an imported waveform. Using this app, you can:
Import waveforms from baseband files (
.bb) or MATLAB files (.mat). The app requires the imported waveform to have fields labeled:waveform— Time-domain signal, specified as a complex-valued NS-by-NR matrix, where NS is the number of time-domain samples and NR is the number of receive antennas.fs— Waveform sample rate in Hertz.
If the imported waveform does not contain a field labeled
waveform, the app uses the first field that is a vector or a 2D matrix of a double or single data type with complex number support as the input waveform. When a field labeledfsis not present, the app uses the current value of the Sample rate field in its Waveform Parameters section.Detect an IEEE 802.11a™, IEEE 802.11n™, IEEE 802.11ac™, IEEE 802.11ax™, or IEEE 802.11be packet in an imported waveform.
Capture waveforms using a connected spectrum analyzer instrument that supports the virtual instrument software architecture (VISA) interface (requires Instrument Control Toolbox™).
Configure demodulation parameters to demodulate the waveform.
Analyze the demodulated waveform.
Visualize waveforms. You can choose from various visualization options such as spectrum analyzer, constellation diagram, and analysis summaries.
Export the results to files, or save them as workspace variables.
The WLAN Waveform Analyzer is capable of detecting, decoding, and analyzing a single packet within a waveform. For detecting, decoding, and analyzing multiple packets within a waveform, see the Recover and Analyze Packets in 802.11 Waveform example.
Open the WLAN Waveform Analyzer App
MATLAB® Toolstrip: On the Apps tab, under Wireless Communications, click the app icon.

MATLAB Command Prompt: Enter
wlanWaveformAnalyzer(since R2026a)
Examples
Analyze and visualize imported or captured WLAN waveforms, and export analysis results, using the WLAN Waveform Analyzer app.
Open the WLAN Waveform Analyzer App
On the Apps tab of the MATLAB Toolstrip, under Wireless Communications, click the WLAN Waveform Analyzer app icon. This icon opens the Wireless Waveform Analyzer app configured for WLAN waveform analysis.
Import WLAN Waveform
To import a waveform, click Import Waveform in the Waveform section of the app toolstrip, then select Import from File or Import from Workspace. You can use the WLAN Waveform Generator app to create WLAN waveforms, and then export them to a .bb file, .mat file, .txt file, or a workspace variable.
If you import from a file, you can use a MAT file containing either a waveform variable or a structure of form
struct('waveform',waveform,'fs',fs). You can also import a .bbfile generated by the WLAN Waveform Generator app, or a.txtfile containing in-phase and quadrature (IQ) data.If you import from the workspace, you can either import a workspace variable of data type
singleordouble, or a workspace variable that is a structure of formstruct('waveform',waveform,'fs',fs).
Once you import the waveform, the app lists out the IQ sample source and sample rate in the Waveform Parameters pane. If you select a file that does not contain sample rate information, update Sample rate (Hz) manually. Additionally, regardless of the imported waveform, you must always manually update Channel bandwidth. The value of Channel bandwidth must be less than or equal to the value of Sample rate.
Capture WLAN Waveform
You can capture waveforms using a connected spectrum analyzer instrument that supports the virtual instrument software architecture (VISA) interface. The waveform capture capability requires:
An Instrument Control Toolbox™ license.
The Instrument Control Toolbox Support Package for Keysight IO Libraries and VISA Interface or Instrument Control Toolbox Support Package for R&S VISA Interface, depending on the spectrum analyzer instrument you use.
Minimum VISA driver versions: Keysight IO Libraries version 18.1.24715.0 (Keysight Connection Expert 2019) or Rohde & Schwarz R&S VISA version 5.12, depending on your spectrum analyzer instrument.
To capture a waveform, click Capture with Hardware in the Waveform section. Set the instrument parameters such as center frequency, span, sample rate, capture time, and gain. Click Start Capture.
Set Demodulation Parameters
In the Demodulation Parameters section of the Waveform pane, set the relevant parameters.
By default, the DC block, Track pilot time, Track pilot phase, and Track pilot gain parameters are enabled.
Analyze and Visualize Waveform
To start the waveform analysis, click Analyze in the Analysis section.
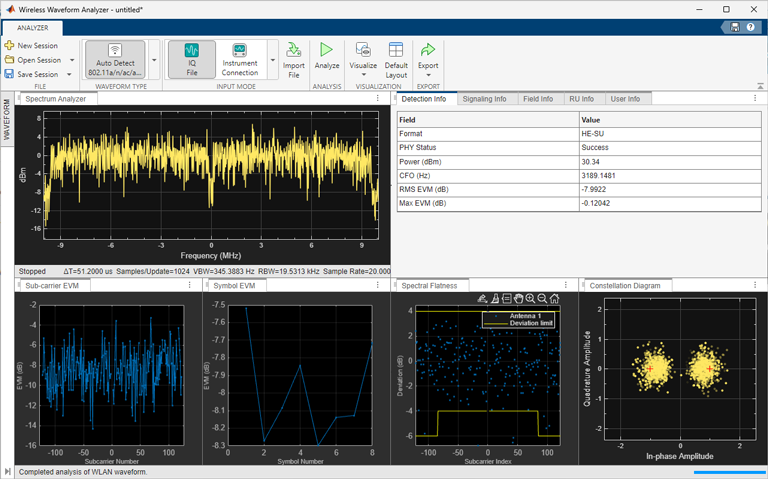
You can choose from a range of visualization options such as a spectrum analyzer, time scope, constellation diagram, spectral flatness plot, and various error vector magnitude (EVM) plots from the Visualize drop-down button on the app toolstrip.
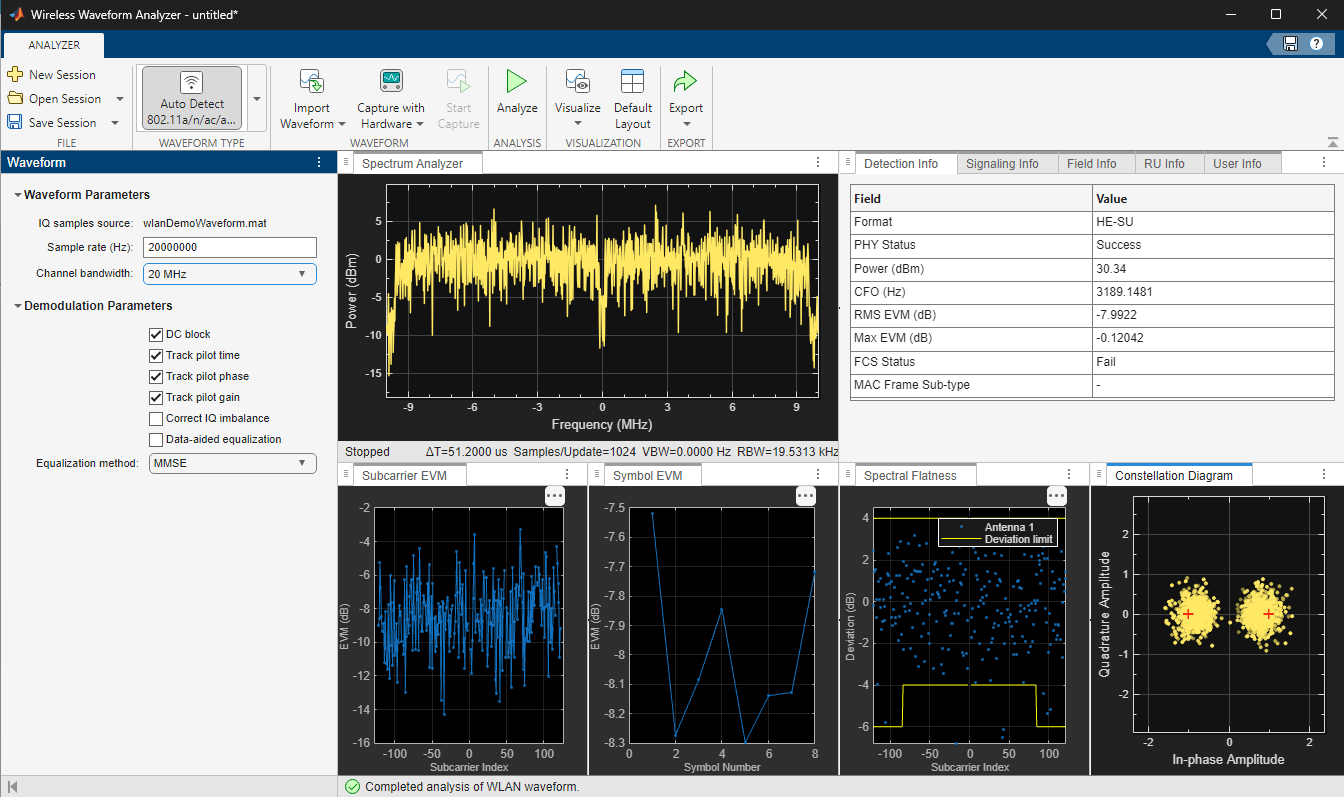
In the top-right pane, select the Detection Info tab. The table on this tab shows information on the waveform detected by the app.
Export Analysis Results
When the analysis is complete, you can export the analysis results to your workspace or to a .mat file. To export the analysis results, click Export and select either Export Results to Workspace or Export Results to MAT File. To save the app session, in the File section of the app toolstrip, click Save Session. Saving the session saves the waveform, waveform parameters, demodulation parameters, and selected visualizations. To open an app session, click Open Session in the File section, and select the saved session you want to open.