Multiple axis in simulink scope
132 次查看(过去 30 天)
显示 更早的评论
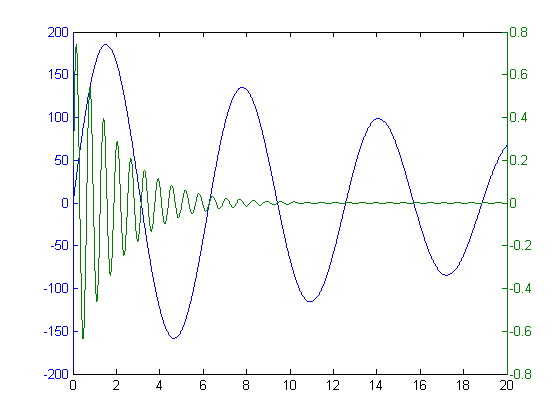
Is it possible to have two graphs with different scales in the same scope (i.e. not a separated layout, like in this question ) ?
In plain matlab it is possible to do something like the following:

I would like to do the same within a simulink scope
0 个评论
采纳的回答
Aghamarsh Varanasi
2020-3-20
Hi ,
Currently the plots in the Scope are limited by only one y-axis. You could show two different signals with different units and rescale the plot to show both signals together, showing separate axes is a workflow currently not supported.
However, I have brought this issue to the concerned people and it might be considered in a future release.
更多回答(1 个)
Alluru Hari Hara Sai Rama krishna
2021-6-14
编辑:Alluru Hari Hara Sai Rama krishna
2021-6-14
How can I display 2 graphs in one axis
另请参阅
Community Treasure Hunt
Find the treasures in MATLAB Central and discover how the community can help you!
Start Hunting!
