主要内容
Results for
2 x 2 행렬의 행렬식은
- 행렬의 두 row 벡터로 정의되는 평행사변형의 면적입니다.
- 물론 두 column 벡터로 정의되는 평행사변형의 면적이기도 합니다.
- 좀 더 정확히는 signed area입니다. 면적이 음수가 될 수도 있다는 뜻이죠.
- 행렬의 두 행(또는 두 열)을 맞바꾸면 행렬식의 부호도 바뀌고 면적의 부호도 바뀌어야합니다.
일반적으로 n x n 행렬의 행렬식은
- 각 row 벡터(또는 각 column 벡터)로 정의되는 N차원 공간의 평행면체(?)의 signed area입니다.
- 제대로 이해하려면 대수학의 개념을 많이 가지고 와야 하는데 자세한 설명은 생략합니다.(=저도 모른다는 뜻)
- 더 자세히 알고 싶으시면 수학하는 만화의 '넓이 이야기' 편을 추천합니다.
- 수학적인 정의를 알고 싶으시면 위키피디아를 보시면 됩니다.
- 이렇게 생겼습니다. 좀 무섭습니다.
아래 코드는...
- 2 x 2 행렬에 대해서 이것을 수식 없이 그림만으로 증명하는 과정입니다.
- gif 생성에는 ScreenToGif를 사용했습니다. (gif 만들기엔 이게 킹왕짱인듯)
Determinant of 2 x 2 matrix is...
- An area of a parallelogram defined by two row vectors.
- Of course, same one defined by two column vectors.
- Precisely, a signed area, which means area can be negative.
- If two rows (or columns) are swapped, both the sign of determinant and area change.
More generally, determinant of n x n matrix is...
- Signed area of parallelepiped defined by rows (or columns) of the matrix in n-dim space.
- For a full understanding, a lot of concepts from abstract algebra should be brought, which I will not write here. (Cuz I don't know them.)
- For a mathematical definition of determinant, visit wikipedia.

- A little scary, isn't it?
The code below is...
- A process to prove the equality of the determinant of 2 x 2 matrix and the area of parallelogram.
- ScreenToGif is used to generate gif animation (which is, to me, the easiest way to make gif).
% 두 점 (a, b), (c, d)의 좌표
a = 4;
b = 1;
c = 1;
d = 3;
% patch 색 pre-define
lightgreen = [144, 238, 144]/255;
lightblue = [169, 190, 228]/255;
lightorange = [247, 195, 160]/255;
% animation params.
anim_Nsteps = 30;
% create window
figure('WindowStyle','docked')
ax = axes;
ax.XAxisLocation = 'origin';
ax.YAxisLocation = 'origin';
ax.XTick = [];
ax.YTick = [];
hold on
ax.XLim = [-.4, a+c+1];
ax.YLim = [-.4, b+d+1];
% create ad-bc patch
area = patch([0, a, a+c, c], [0, b, b+d, d], lightgreen);
p_ab = plot(a, b, 'ko', 'MarkerFaceColor', 'k');
p_cd = plot(c, d, 'ko', 'MarkerFaceColor', 'k');
p_ab.UserData = text(a+0.1, b, '(a, b)', 'FontSize',16);
p_cd.UserData = text(c+0.1, d-0.2, '(c, d)', 'FontSize',16);
area.UserData = text((a+c)/2-0.5, (b+d)/2, 'ad-bc', 'FontSize', 18);
pause
%% Is this really ad-bc?
area.UserData.String = 'ad-bc...?';
pause
%% fade out ad-bc
fadeinout(area, 0)
area.UserData.Visible = 'off';
pause
%% fade in ad block
rect_ad = patch([0, a, a, 0], [0, 0, d, d], lightblue, 'EdgeAlpha', 0, 'FaceAlpha', 0);
uistack(rect_ad, 'bottom');
fadeinout(rect_ad, 1, t_pause=0.003)
draw_gridline(rect_ad, ["23", "34"])
rect_ad.UserData = text(mean(rect_ad.XData), mean(rect_ad.YData), 'ad', 'FontSize', 20, 'HorizontalAlignment', 'center');
pause
%% fade-in bc block
rect_bc = patch([0, c, c, 0], [0, 0, b, b], lightorange, 'EdgeAlpha', 0, 'FaceAlpha', 0);
fadeinout(rect_bc, 1, t_pause=0.0035)
draw_gridline(rect_bc, ["23", "34"])
rect_bc.UserData = text(b/2, c/2, 'bc', 'FontSize', 20, 'HorizontalAlignment', 'center');
pause
%% slide ad block
patch_slide(rect_ad, ...
[0, 0, 0, 0], [0, b, b, 0], t_pause=0.004)
draw_gridline(rect_ad, ["12", "34"])
pause
%% slide ad block
patch_slide(rect_ad, ...
[0, 0, d/(d/c-b/a), d/(d/c-b/a)],...
[0, 0, b/a*d/(d/c-b/a), b/a*d/(d/c-b/a)], t_pause=0.004)
draw_gridline(rect_ad, ["14", "23"])
pause
%% slide bc block
uistack(p_cd, 'top')
patch_slide(rect_bc, ...
[0, 0, 0, 0], [d, d, d, d], t_pause=0.004)
draw_gridline(rect_bc, "34")
pause
%% slide bc block
patch_slide(rect_bc, ...
[0, 0, a, a], [0, 0, 0, 0], t_pause=0.004)
draw_gridline(rect_bc, "23")
pause
%% slide bc block
patch_slide(rect_bc, ...
[d/(d/c-b/a), 0, 0, d/(d/c-b/a)], ...
[b/a*d/(d/c-b/a), 0, 0, b/a*d/(d/c-b/a)], t_pause=0.004)
pause
%% finalize: fade out ad, bc, and fade in ad-bc
rect_ad.UserData.Visible = 'off';
rect_bc.UserData.Visible = 'off';
fadeinout([rect_ad, rect_bc, area], [0, 0, 1])
area.UserData.String = 'ad-bc';
area.UserData.Visible = 'on';
%% functions
function fadeinout(objs, inout, options)
arguments
objs
inout % 1이면 fade-in, 0이면 fade-out
options.anim_Nsteps = 30
options.t_pause = 0.003
end
for alpha = linspace(0, 1, options.anim_Nsteps)
for i = 1:length(objs)
switch objs(i).Type
case 'patch'
objs(i).FaceAlpha = (inout(i)==1)*alpha + (inout(i)==0)*(1-alpha);
objs(i).EdgeAlpha = (inout(i)==1)*alpha + (inout(i)==0)*(1-alpha);
case 'constantline'
objs(i).Alpha = (inout(i)==1)*alpha + (inout(i)==0)*(1-alpha);
end
pause(options.t_pause)
end
end
end
function patch_slide(obj, x_dist, y_dist, options)
arguments
obj
x_dist
y_dist
options.anim_Nsteps = 30
options.t_pause = 0.003
end
dx = x_dist/options.anim_Nsteps;
dy = y_dist/options.anim_Nsteps;
for i=1:options.anim_Nsteps
obj.XData = obj.XData + dx(:);
obj.YData = obj.YData + dy(:);
obj.UserData.Position(1) = mean(obj.XData);
obj.UserData.Position(2) = mean(obj.YData);
pause(options.t_pause)
end
end
function draw_gridline(patch, where)
ax = patch.Parent;
for i=1:length(where)
v1 = str2double(where{i}(1));
v2 = str2double(where{i}(2));
x1 = patch.XData(v1);
x2 = patch.XData(v2);
y1 = patch.YData(v1);
y2 = patch.YData(v2);
if x1==x2
xline(x1, 'k--')
else
fplot(@(x) (y2-y1)/(x2-x1)*(x-x1)+y1, [ax.XLim(1), ax.XLim(2)], 'k--')
end
end
end
I recently discovered a 2-minute video that introduces MatGPT, and I believe it's a resource worth sharing. The creator highlights MatGPT's impressive capabilities by demonstrating how it tackles the classic Travelling Salesman Problem.
With more than 13,000 downloads on File Exchange, MatGPT is gaining traction among users. I strongly recommend taking it for a spin to experience its potential firsthand.
how accurate are the answers of the AI Playground regarding information that are not specifiyed in the documentation?
We're thrilled to announce the roll-out of some new features that are going to supercharge your Playground experience! Here's what's new:
Copy/Download code from the script area
You can now effortlessly Copy/Download code from the script area with just a single click. Copy code or Download your script directly as .m files and keep your work organized and portable.We hope this will allow you to effortlessly transfer your work from Playground to MATLAB Desktop/Online.
Run Code directly from the Chat panel
Execute code snippets from the chat section with a single click. This new affordance means saving a step since you no longer have to insert code and then hit run from the toolstrip to execute instead just hit run in the chat panel to see the output immediately in the script area
Enhanced visual Experience
Customize your Playground workspace by expanding or collapsing the chat and script sections. Focus on what matters most to you, whether it's AI chat or working on your script.

We hope you will love these updates. Try them out and let us know your feedback.
When I want to understand a problem, I'll often use different sources. I'll read different textbooks, blog posts, research papers and ask the same question to different people. The differences in the solutions are almost always illuminating.
I feel the same way about AIs. Sometimes, I don't want to ask *THE* AI...I want to ask a bunch of them. They'll have different strengths and weaknesses..different personalities if you want to think of it that way.
I've been playing with the AI chat arena and there really is a lot of difference between the answers returned by different models. https://lmarena.ai/?arena
I think it would be great if the MATLAB Chat playgroundwere to allow the user to change which AI they were talking with.
What does everyone else think?
how can i use this AI?
I have been finding the AI Chat Playground very useful for daily MATLAB use. In particular it has been very useful for me in basically replacing or supplementing dives into MATLAB documentation. The documentation for MATLAB is in my experience uniformly excellent and thorough but it is sometimes lengthy and hard to parse and the AI Chat is a great one stop shop for many questions I have. However, I would find it very useful if the AI Chat could answer my queries and then also supply a link directly to the documentation. E.g. a box at the bottom of the answer that is basically
"Here is the documentation on the functions AI Chat referred to in this response"
could be neat.
I recently wrote about the new ODE solution framework in MATLAB over the The MATLAB Blog The new solution framework for Ordinary Differential Equations (ODEs) in MATLAB R2023b » The MATLAB Blog - MATLAB & Simulink (mathworks.com)
This was a very popular post at the time - many thousands of views. Clearly everyone cares about ODEs in MATLAB.
This made me wonder. If you could wave a magic wand, what ODE functionality would you have next and why?
Hi
I am using simulink for the frequency response analysis of the three phase induction motor stator winding.
The problem is that i can't optimise the pramaeter values manually, for this i have to use genetic algrothem. But iam stucked how to use genetic algorithum to optimise my circuit paramter values like RLC. Any guidence will be highly appreciated.

I'm having problem in its test 6 ... passing 5/6 what would be the real issue..
am wring Transformation matrix correct.. as question said SSW should be 202.5 degree...
so what is the issue..
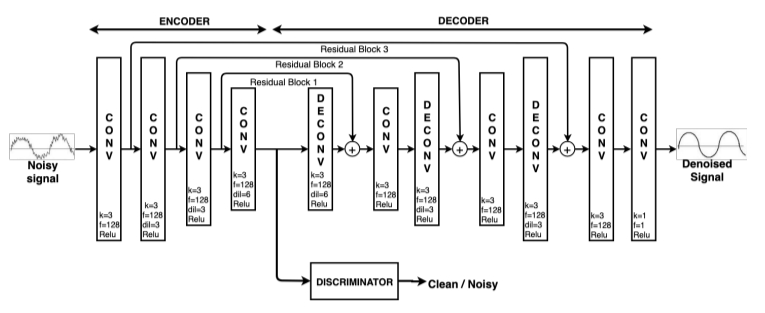
I am a beginner of deep learning, and meet with some problems in learning the MATLAB example "Denoise Signals with Adversarial Learning Denoiser Model", hope very much to get help!
1. visualizaition of the features
It is my understanding that the encoded representation of the autoencoder is the features of the original signal. However in this example, the output dimension of the encoder is 64xSignalLength. Does it mean that every sample point of the signal has 64 features?
2. usage of the residual blocks
The encoder-decoder model uses residual blocks (which contribute to reconstructing the denoised signal from the latent space, ). However, only the encoder output is connected to the discriminator. Doesn't it cause the prolem that most features will be learned by the residual blocks, and only a few features that could confuse the discriminator will be learned by the encoder and sent to the discriminator?
Is there a reason for TMW not to invest in 3D polyshapes? Is the mathematical complexity of having all the same operations in 3D (union, intersection, subtract,...) prohibitive?
I have been developing a neural net to extract a set of generative parameters from an image of a 2-D NMR spectrum. I use a pair of convolution layers each followed by a fullyconnected layer; the pair are joined by an addtion layer and that fed to a regression layer. This trains fine, but answers are sub-optimal. I woudl like to add a fully connected layer between the addtion layer and regression, but training using default training scripts simply won't converge. Any suggestions? Maybe I can start with the pre-trained weights for the convolution layers, but I don't know how to do this.
JHP
This is not a question, it is my attempt at complying with the request for thumbs up/down voting. I vote thumbs up, for having AI.....
I am not sure if specific AI errors are to be reported. Other messages I just read from others here and the AI Chat itself clearly state that errors abound.
My AI request was: "Plot 300 points of field 2"
AI Chat gave me, in part:
data = thingSpeakRead(channelID, 'Fields', 2, 'NumPoints', 300, 'ReadKey', readAPIKey);
% Extract the field values
field1Values = data.Field1;
% Plot the data
plot(field1Values);
The AI code failed due to "Dot indexing is not supported for variables of this type"
So, I corrected the code thus to get the correct plot:
data = thingSpeakRead(channelID, 'Fields', 2, 'NumPoints', 300, 'ReadKey', readAPIKey);
% Extract the field values
%field1Values = data.Field1;
% Plot the data
plot(data);
I see great promise in AI Chat.
Opie
Quick answer: Add set(hS,'Color',[0 0.4470 0.7410]) to code line 329 (R2023b).
Explanation: Function corrplot uses functions plotmatrix and lsline. In lsline get(hh(k),'Color') is called in for cycle for each line and scatter object in axes. Inside the corrplot it is also called for all axes, which is slow. However, when you first set the color to any given value, internal optimization makes it much faster. I chose [0 0.4470 0.7410], because it is a default color for plotmatrix and corrplot and this setting doesn't change a behavior of corrplot.
Suggestion for a better solution: Add the line of code set(hS,'Color',[0 0.4470 0.7410]) to the function plotmatrix. This will make not only corrplot faster, but also any other possible combinations of plotmatrix and get functions called like this:
h = plotmatrix(A);
% set(h,'Color',[0 0.4470 0.7410])
for k = 1:length(h(:))
get(h(k),'Color');
end
Write a matlab script that will print the odd numbers, 1 through 20, in reverse.
I cannot figure out how to do this correctly, please help.
I think it would be a really great feature to be able to add an Alpha property to the basic "Line" class in MATLAB plots. I know that I have previously had to resort to using Patch to be able to plot semitransparent lines, but there are also so many other functions that rely on the "Line" class.
For example, if you want to make a scatter plot from a table with things specified into groups, you can use ScatterHistogram or gscatter but since gscatter uses the Line class, you can't adjust the marker transparency. So if you don't want the histograms, you are stuck with manually separating it and using scatter with hold on.
I saw this post on Answers.
I was impressed at the capability of the AI, as I have been at other times when I posed a question to it, at least some of the time. So much so that I wondered...
What if the AI were automatically applied to EVERY question on Answers? Would that be a good or bad thing? For example, suppose the AI automatically offers an answer to every question as soon as it gets posted? Of course, users would still be allowed to post their own, possibly better answers. But would it tend to disincentivise individuals from ansering questions?
Perhaps as bad, would it push Answers into the mode of a homework solving forum? Since if every homework question gets a possibly pretty good automatic AI generated solution, then every student will just post all HW questions, and the forum would quickly become overwhelmed.
I suppose one idea could be to set up the AI to post an answer to all un-answered questions that are at least one month old. Then students would not gain by posting their homework.
Hi Guys
Posting this based on a thought I had, so I don't really ahve any code however I would like to know if the thought process is correct and/or relatively accurate.
Consider a simple spring mass system which only allows compression on the spring however when there is tension the mass should move without the effect of the spring distrupting it, thus the mass is just thrown vertically upwards.
The idea which I came up with for such a system is to have two sets of dfferential equations, one which represents the spring system and another which presents a mass in motion without the effects of the spring.
Please refer to the below basic outline of the code which I am proposing. I believe that this may produce relatively decent results. The code essentially checks if there is tension in the system if there is it then takes the last values from the spring mass differential equation and uses it as initial conditions for the differential equation with the mass moving wothout the effects of the spring, this process works in reverse also. The error which would exist is that the initial conditions applied to the system would include effects of the spring. Would there be a better way to code such behaviour?
function xp = statespace(t,x,f,c,k,m)
if (k*x(1)) positive #implying tension
**Use last time step as initial conditions**
**differential equation of a mass moving""
end
if x(1) negative #implying that the mass in now moving down therefore compression in spring
**Use last time step as initial conditions**
**differential equation for a spring mass system**
end
end
您也可以从以下列表中选择网站:
美洲
- América Latina (Español)
- Canada (English)
- United States (English)
欧洲
- Belgium (English)
- Denmark (English)
- Deutschland (Deutsch)
- España (Español)
- Finland (English)
- France (Français)
- Ireland (English)
- Italia (Italiano)
- Luxembourg (English)
- Netherlands (English)
- Norway (English)
- Österreich (Deutsch)
- Portugal (English)
- Sweden (English)
- Switzerland
- United Kingdom(English)
亚太
- Australia (English)
- India (English)
- New Zealand (English)
- 中国
- 日本Japanese (日本語)
- 한국Korean (한국어)