搜索
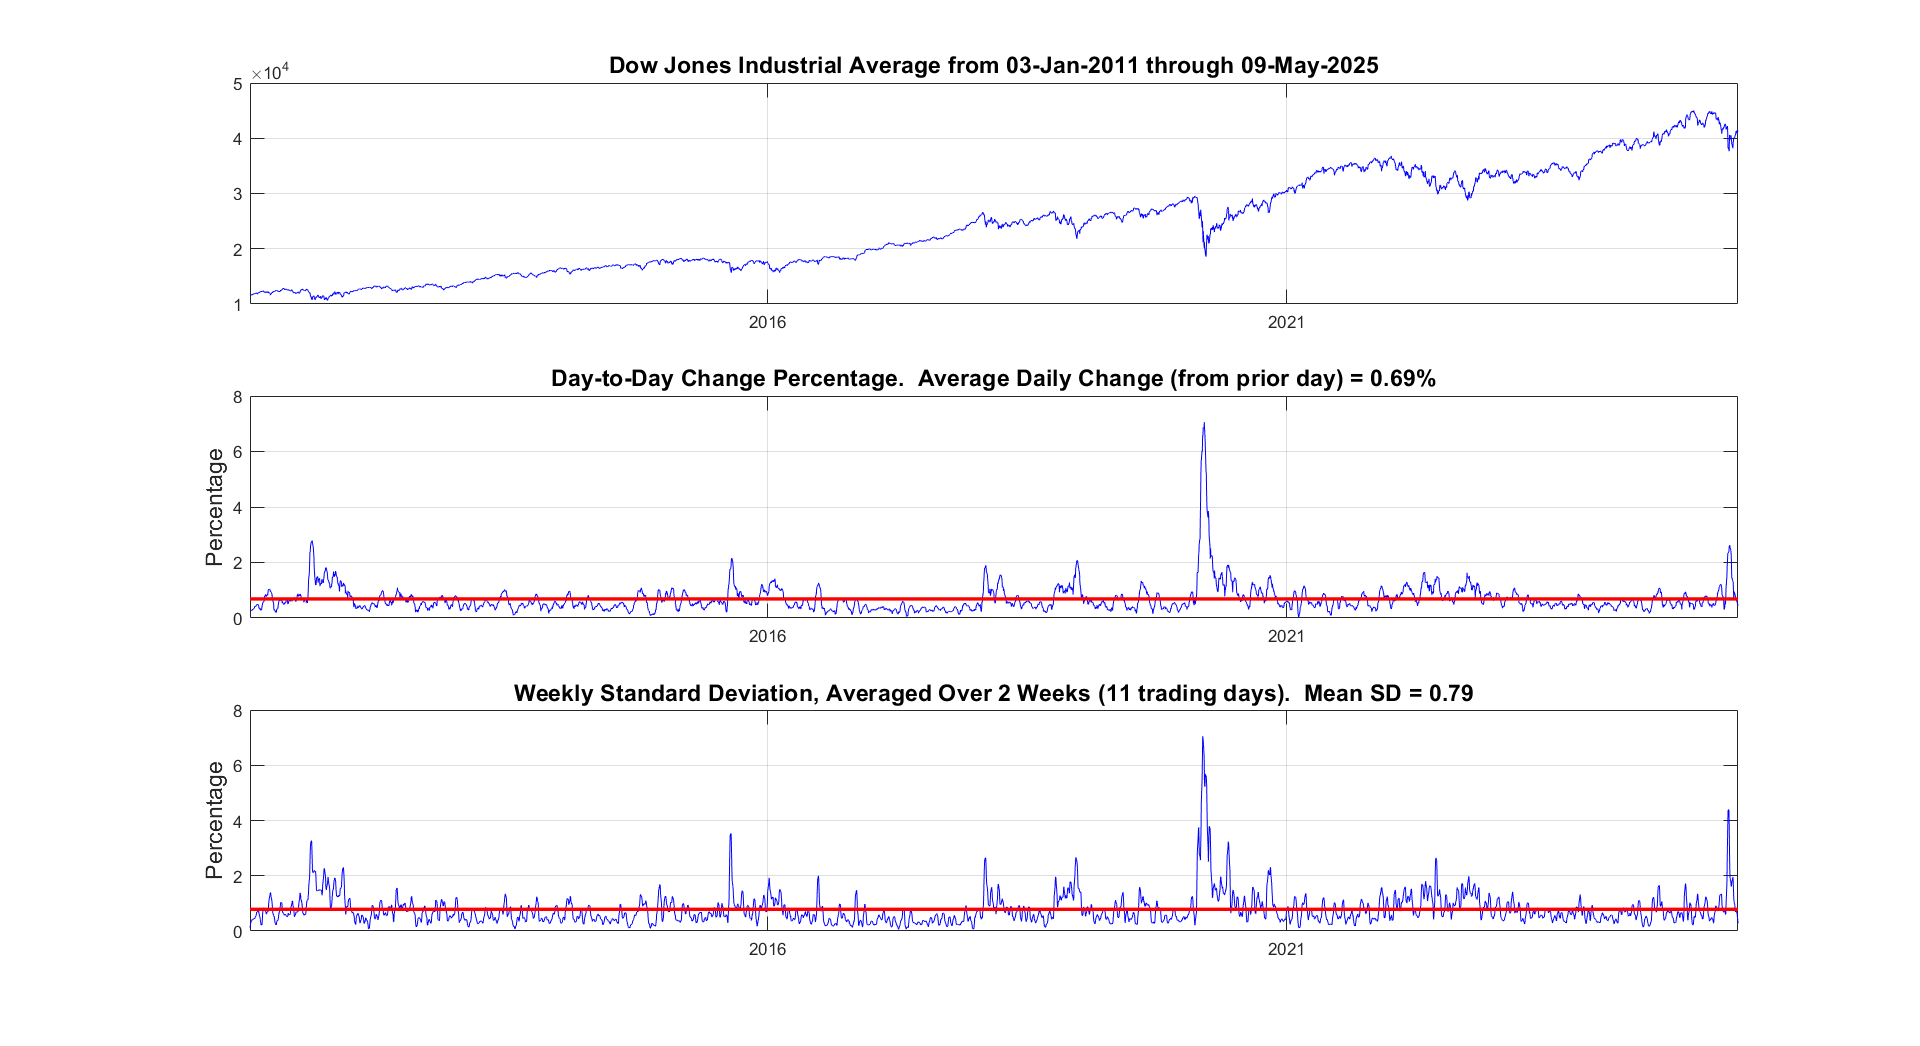
It seems like the financial news is always saying the stock market is especially volatile now. But is it really? This code will show you the daily variation from the prior day. You can see that the average daily change from one day to the next is 0.69%. So any change in the stock market from the prior day less than about 0.7% or 1% is just normal "noise"/typical variation. You can modify the code to adjust the starting date for the analysis. Data file (Excel workbook) is attached (hopefully - I attached it twice but it's not showing up yet).
% Program to plot the Dow Jones Industrial Average from 1928 to May 2025, and compute the standard deviation.
% Data available for download at https://finance.yahoo.com/quote/%5EDJI/history?p=%5EDJI
% Just set the Time Period, then find and click the download link, but you ned a paid version of Yahoo.
%
% If you have a subscription for Microsoft Office 365, you can also get historical stock prices.
% Reference: https://support.microsoft.com/en-us/office/stockhistory-function-1ac8b5b3-5f62-4d94-8ab8-7504ec7239a8#:~:text=The%20STOCKHISTORY%20function%20retrieves%20historical,Microsoft%20365%20Business%20Premium%20subscription.
% For example put this in an Excel Cell
% =STOCKHISTORY("^DJI", "1/1/2000", "5/10/2025", 0, 1, 0, 1,2,3,4, 5)
% and it will fill out a table in Excel
%====================================================================================================================
clc; % Clear the command window.
close all; % Close all figures (except those of imtool.)
imtool close all; % Close all imtool figures if you have the Image Processing Toolbox.
clear; % Erase all existing variables. Or clearvars if you want.
workspace; % Make sure the workspace panel is showing.
format long g;
format compact;
fontSize = 14;
filename = 'Dow Jones Industrial Index.xlsx';
data = readtable(filename);
% Date,Close,Open,High,Low,Volume
dates = data.Date;
closing = data.Close;
volume = data.Volume;
% Define start date and stop date
startDate = datetime(2011,1,1)
stopDate = dates(end)
selectedDates = dates > startDate;
% Extract those dates:
dates = dates(selectedDates);
closing = closing(selectedDates);
volume = volume(selectedDates);
% Plot Volume
hFigVolume = figure('Name', 'Daily Volume');
plot(dates, volume, 'b-');
grid on;
xticks(startDate:calendarDuration(5,0,0):stopDate)
title('Dow Jones Industrial Average Volume', 'FontSize', fontSize);
hFig = figure('Name', 'Daily Standard Deviation');
subplot(3, 1, 1);
plot(dates, closing, 'b-');
xticks(startDate:calendarDuration(5,0,0):stopDate)
drawnow;
grid on;
caption = sprintf('Dow Jones Industrial Average from %s through %s', dates(1), dates(end));
title(caption, 'FontSize', fontSize);
% Get the average change from one trading day to the next.
diffs = 100 * abs(closing(2:end) - closing(1:end-1)) ./ closing(1:end-1);
subplot(3, 1, 2);
averageDailyChange = mean(diffs)
% Looks pretty noisy so let's smooth it for a nicer display.
numWeeks = 4;
diffs = sgolayfilt(diffs, 2, 5*numWeeks+1);
plot(dates(2:end), diffs, 'b-');
grid on;
xticks(startDate:calendarDuration(5,0,0):stopDate)
hold on;
line(xlim, [averageDailyChange, averageDailyChange], 'Color', 'r', 'LineWidth', 2);
ylabel('Percentage', 'FontSize', fontSize);
caption = sprintf('Day-to-Day Change Percentage. Average Daily Change (from prior day) = %.2f%%', averageDailyChange);
title(caption, 'FontSize', fontSize);
drawnow;
% Get the stddev over a 5 trading day window.
sd = stdfilt(closing, ones(5, 1));
% Get it relative to the magnitude.
sd = sd ./ closing * 100;
averageVariation = mean(sd)
numWeeks = 2;
% Looks pretty noisy so let's smooth it for a nicer display.
sd = sgolayfilt(sd, 2, 5*numWeeks+1);
% Plot it.
subplot(3, 1, 3);
plot(dates, sd, 'b-');
grid on;
xticks(startDate:calendarDuration(5,0,0):stopDate)
hold on;
line(xlim, [averageVariation, averageVariation], 'Color', 'r', 'LineWidth', 2);
ylabel('Percentage', 'FontSize', fontSize);
caption = sprintf('Weekly Standard Deviation, Averaged Over %d Weeks (%d trading days). Mean SD = %.2f', ...
numWeeks, 5*numWeeks+1, averageVariation);
title(caption, 'FontSize', fontSize);
% Maximize figure window.
g = gcf;
g.WindowState = 'maximized';
Attaching the Photoshop file if you want to modify the caption.
Christmas season is underway at my house:

(Sorry - the ornament is not available at the MathWorks Merch Shop -- I made it with a 3-D printer.)
My favorite image processing book is The Image Processing Handbook by John Russ. It shows a wide variety of examples of algorithms from a wide variety of image sources and techniques. It's light on math so it's easy to read. You can find both hardcover and eBooks on Amazon.com Image Processing Handbook
There is also a Book by Steve Eddins, former leader of the image processing team at Mathworks. Has MATLAB code with it. Digital Image Processing Using MATLAB
You might also want to look at the free online book http://szeliski.org/Book/
Imagine that the earth is a perfect sphere with a radius of 6371000 meters and there is a rope tightly wrapped around the equator. With one line of MATLAB code determine how much the rope will be lifted above the surface if you cut it and insert a 1 meter segment of rope into it (and then expand the whole rope back into a circle again, of course).
Swimming, diving
16%
Other water-based sport
4%
Gymnastics
20%
Other indoor arena sport
15%
track, field
24%
Other outdoor sport
21%
346 个投票
Hello, everyone! I’m Mark Hayworth, but you might know me better in the community as Image Analyst. I've been using MATLAB since 2006 (18 years). My background spans a rich career as a former senior scientist and inventor at The Procter & Gamble Company (HQ in Cincinnati). I hold both master’s & Ph.D. degrees in optical sciences from the College of Optical Sciences at the University of Arizona, specializing in imaging, image processing, and image analysis. I have 40+ years of military, academic, and industrial experience with image analysis programming and algorithm development. I have experience designing custom light booths and other imaging systems. I also work with color and monochrome imaging, video analysis, thermal, ultraviolet, hyperspectral, CT, MRI, radiography, profilometry, microscopy, NIR, and Raman spectroscopy, etc. on a huge variety of subjects.
I'm thrilled to participate in MATLAB Central's Ask Me Anything (AMA) session, a fantastic platform for knowledge sharing and community engagement. Following Adam Danz’s insightful AMA on staff contributors in the Answers forum, I’d like to discuss topics in the area of image analysis and processing. I invite you to ask me anything related to this field, whether you're seeking recommendations on tools, looking for tips and tricks, my background, or career development advice. Additionally, I'm more than willing to share insights from my experiences in the MATLAB Answers community, File Exchange, and my role as a member of the Community Advisory Board. If you have questions related to your specific images or your custom MATLAB code though, I'll invite you to ask those in the Answers forum. It's a more appropriate forum for those kinds of questions, plus you can get the benefit of other experts offering their solutions in addition to me.
For the coming weeks, I'll be here to engage with your questions and help shed light on any topics you're curious about.
In one line of MATLAB code, compute how far you can see at the seashore. In otherwords, how far away is the horizon from your eyes? You can assume you know your height and the diameter or radius of the earth.
American style football
12%
Soccer / football
39%
baseball
5%
basketball
12%
tennis or golf
7%
rugby, track, cricket, racing, etc.
26%
3712 个投票

Wait for Walter, the rest of us are mere users.
MATLAB Training

MATLAB Training

Mathworks tech support

Stand Back. I'm going to try MATLAB.
Embarassed by Walter Roberson

I use MATLAB.

MATLAB Reloaded

MATLAB Men