主要内容
搜索
Do you boast about the energy savings you racking up by using dark mode while stashing your energy bill savings away for an exotic vacation🌴🥥? Well, hold onto your sun hats and flipflops!
A recent study presented at the 1st Internaltional Workshop on Low Carbon Computing suggests that you may be burning more ⚡energy⚡ with your slick dark displays 💻[1].
In a 2x2 factorial design, ten participants viewed a webpage in dark and light modes in both dim and lit settings using an LCD monitor with 16 brightness levels.
- 80% of participants increased the monitor's brightness in dark mode [2]
- This occurred in both lit and dim rooms
- Dark mode did not reduce power draw but increasing monitor brightness did.
The color pixels in an LCD monitor still draw voltage when the screen is black, which is why the monitor looks gray when displaying a pure black background in a dark room. OLED monitors, on the other hand, are capable of turning off pixels that represent pure black and therefore have the potential to save energy with dark mode. A 2021 Purdue study estimates a 3%-9% energy savings with dark mode on OLED monitors using auto-brightness [3]. However, outside of gaming, OLED monitors have a very small market share and still account for less than 25% within the gaming world.
Any MATLAB users out there with OLED monitors? How are you going to spend your mad cash savings when you start using MATLAB's upcoming dark theme?
- BBC study: https://www.sicsa.ac.uk/wp-content/uploads/2024/11/LOCO2024_paper_12.pdf
- BBC blog article https://www.bbc.co.uk/rd/articles/2025-01-sustainability-web-energy-consumption
- 2021 Purdue https://dl.acm.org/doi/abs/10.1145/3458864.3467682
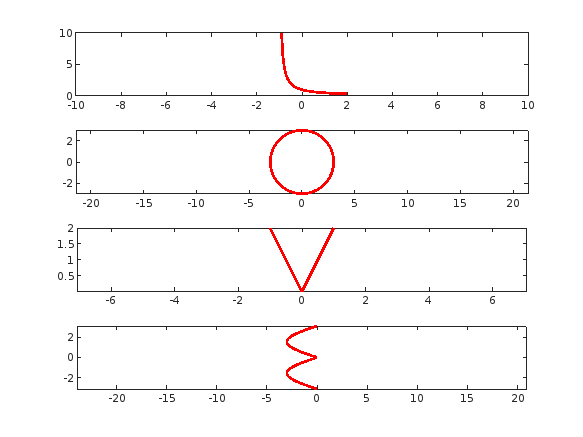
tiledlayout(4,1);
% Plot "L" (y = 1/(x+1), for x > -1)
x = linspace(-0.9, 2, 100); % Avoid x = -1 (undefined)
y =1 ./ (x+1) ;
nexttile;
plot(x, y, 'r', 'LineWidth', 2);
xlim([-10,10])
% Plot "O" (x^2 + y^2 = 9)
theta = linspace(0, 2*pi, 100);
x = 3 * cos(theta);
y = 3 * sin(theta);
nexttile;
plot(x, y, 'r', 'LineWidth', 2);
axis equal;
% Plot "V" (y = -2|x|)
x = linspace(-1, 1, 100);
y = 2 * abs(x);
nexttile;
plot(x, y, 'r', 'LineWidth', 2);
axis equal;
% Plot "E" (x = -3 |sin(y)|)
y = linspace(-pi, pi, 100);
x = -3 * abs(sin(y));
nexttile;
plot(x, y, 'r', 'LineWidth', 2);
axis equal;
syms p
f=2-ellipticK(p)
x0=0.1
a=fzero(f,x0)
I've been trying this problem a lot of time and i don't understand why my solution doesnt't work.
In 4 tests i get the error Assertion failed but when i run the code myself i get the diag and antidiag correctly.
function [diag_elements, antidg_elements] = your_fcn_name(x)
[m, n] = size(x);
% Inicializar los vectores de la diagonal y la anti-diagonal
diag_elements = zeros(1, min(m, n));
antidg_elements = zeros(1, min(m, n));
% Extraer los elementos de la diagonal
for i = 1:min(m, n)
diag_elements(i) = x(i, i);
end
% Extraer los elementos de la anti-diagonal
for i = 1:min(m, n)
antidg_elements(i) = x(m-i+1, i);
end
end
How do I make and export a brushed area from a figure
Hi all,
I'm working on quite some time to improve the code which I've written for better visualization of A0 mode. In my code everything looks good even I'm able to track the properties of the wave like out-of-plane and in-plane displacement but it is only evident and observable only at the extreme edges of the x (defined window). I'm attaching my code below. Any idea will be greatly appreciated. I'm also attaching the link of reference video which I'm trying to achieve or atleast anything close to it.
"freq = 2.5; %% KHz
Cpasym = 2.8953; %%phase velocity
d = 1; %% thickness of AL plate
Cl = 6.350; %% longitudnal velocity in the Al
Ct = 3.130; %% transverse velocity in the AL
zrange = -0.5:0.01:0.5;
shape = zeros(length(zrange),3);
for i = 1:length(zrange)
z = zrange(i);
shape(i,1) = z;
%% Mode shape in plane
Uasym = (2*pi*freq/Cpasym)*((sinh(sqrt(1/Cpasym^2-1/Cl^2)*2*pi*freq*z)/cosh(sqrt(1/Cpasym^2-1/Cl^2)*2*pi*freq*0.5*d))-(2*((2*pi*freq)^2*(1/Cpasym^2-1/Cl^2)^0.5*(1/Cpasym^2-1/Ct^2)^0.5)/((2/Cpasym^2-1/Ct^2)*(2*pi*freq)^2))*(sinh(sqrt(1/Cpasym^2-1/Ct^2)*2*pi*freq*z)/cosh(sqrt(1/Cpasym^2-1/Ct^2)*2*pi*freq*0.5*d)));
%% Mode shape out of plane
Wasym = (sqrt(1/Cpasym^2-1/Cl^2)*2*pi*freq)*((cosh(sqrt(1/Cpasym^2-1/Cl^2)*2*pi*freq*z)/cosh(sqrt(1/Cpasym^2-1/Cl^2)*2*pi*freq*0.5*d))-(2*(2*pi*freq/Cpasym)^2/((2/Cpasym^2-1/Ct^2)*(2*pi*freq)^2))*(cosh(sqrt(1/Cpasym^2-1/Ct^2)*2*pi*freq*z)/cosh(sqrt(1/Cpasym^2-1/Ct^2)*2*pi*freq*0.5*d)));
shape(i,2) = real(Uasym);
shape(i,3) = real(Wasym);
end
%% Normalizing the Mode shape
shape(:,2) = shape(:,2)/max(abs(shape(:,2)));
shape(:,3) = shape(:,3)/max(abs(shape(:,3)));
tvec = 0:0.01:10;
xvec = 0:0.01:9.5;
[X, Z] = meshgrid(xvec, zrange);
UAsym3D = zeros(length(zrange),length(xvec), length(tvec));
WAsym3D = zeros(length(zrange),length(xvec), length(tvec));
%% propogation governing equation
for i = 1:length(tvec)
for k = 1:length(xvec)
%for j = 1:length(zrange)
Ux = shape(:,2).*sin((2*pi*freq/Cpasym)*xvec(k)-(2*pi*freq*tvec(i)));
UAsym3D(:,k,i) = Ux;
Wz = shape(:,3).*cos((2*pi*freq/Cpasym)*xvec(k)-(2*pi*freq*tvec(i)));
WAsym3D(:,k,i) = Wz;
%end
end
end
% Normalize to [-1, 1]
UAsym3DN = UAsym3D / (max(abs(UAsym3D(:))));
WAsym3DN = WAsym3D / (max(abs(WAsym3D(:))));
% Create a VideoWriter object
videoFile = 'wave_motionAsym.avi'; % Output file name
writerObj = VideoWriter(videoFile , 'Motion JPEG AVI');
writerObj.FrameRate = 7; % Frames per second
open(writerObj);
hFig = figure('units','normalized','outerposition',[0 0 1 1]);
axis tight manual;
set(gca, 'NextPlot', 'replacechildren');
xlabel('x');
ylabel('z');
title('Resultant Displacement Anti-symmetric(A0) mode');
colormap(jet);
numTimeSteps = size(UAsym3DN, 3);
frames(numTimeSteps) = struct('cdata',[],'colormap',[]);
% Loop through each time step and create frames
for t = 1:size(UAsym3DN, 3)
% Get displacement at current time step
X_new = X + UAsym3DN(:,:, t); % Extract displacement at time t
Z_new = Z+ WAsym3DN(:,:, t); % Extract displacement at time t
scatter(X_new(:), Z_new(:), 5, 'filled');
%quiver(X(:), Z(:), Usym3DN(:,:, t),Wsym3DN(:,:, t), 'k','LineWidth',1);
xlabel('x'); ylabel('z');
axis([min(xvec)-1 max(xvec)+1 min(zrange)-1 max(zrange)+1]);
axis equal;
grid on;
drawnow;
pause(0.002);
frame = getframe(gcf);
frames(t) = frame;
writeVideo(writerObj, frame);
end
% Close the VideoWriter object
close(writerObj);
disp(['Movie saved as ', videoFile]);
implay('wave_motionAsym.avi');"
On 27th February María Elena Gavilán Alfonso and I will be giving an online seminar that has been a while in the making. We'll be covering MATLAB with Jupyter, Visual Studio Code, Python, Git and GitHub, how to make your MATLAB projects available to the world (no installation required!) and much much more.
Sign up (it's free!) at MATLAB Without Borders: Connecting your Projects with Python and other Open-Source Tools - MATLAB & Simulink

Hi Engineers,
I need your help to solve this. I am doing Power Systems Simulation Onramp, in that Represent Power Systems Components, @ Task 5, i have completed all the task instructions as mentioned, but not getting the output, i tried several times. kinldy help or suggest
My full funtion name is function [Y,t] = C2(Y0, dt, T) I have a secondary function dYdt = f_rhs(Y)
x = Y(1);
y = Y(2);
dx_dt = y;
dy_dt = -x + (1 - x^2) .* y;
dYdt = [dx_dt; dy_dt];
end
I keep geting an error when ever I try and add f_rhs into the code for it to call back on - Unable to define function C2 because it has the same name as the file. Any sugesstions?
Hi Control Experts,
I am designing an LQR controller for a system with time delay. The time delay is likely to be an input delay, but there is no certainty.
I have modelled the system as a continuous-time state space system, and I modelled the time delay with Pade approximation.
- I used the pade function in MATLAB to get the Pade transfer function, then I convert into state-space. I augmented the Pade state-space matrices with the state-space matrices of my plant. Am I taking the correct approach?
- My Pade approximation is 2nd order, so my state-space system now have 2 additional states. If I use MATLAB lqr function to get the LQR matrix K, what should the weightings of the Pade states be? Should they be set to very low (because we do not care about set point tracking of Pade states) or very high?
- Can I get some resources (even university lecture materials) that show how to design LQR for systems with time delays modelled with Pade approximations?
Thank you!
So I have taken the 3D UAV obstacle avoidance example and implemeneted path planning using DDPG on it. My agent learns to take the shortest path by avoiding the obstacle but as soon as I define a reset function and spawning the location of the agent between 2 postions it fails to learn. The main issue is that during a single training it learns to reach the goal from one position and when it is spawned to another location it was trainined on it takes the same path as before. The training for a single position is trained in like 100 to 150 episodes whereas when I spawn to two locations it wont converge ever after 10000 episodes.
I'll share the training curve for the agent being spawned at two locations.( Episodes greater than equal to 150 represent that it has reached the goal in the shortest path)
Observation:
Lidar Ranges (40 total ranges with max range of 5)
distance to goal
derivative of distance to goal
(I also tried adding more things to my observation such as pitch,yaw,roll and etc but that ultimately made the agent unable to converge faster)
Actions:
Pitch and Roll( -pi/7 to pi/7)
Yaw (-pi to pi)
Reward Function
Pitch, Roll and Yaw have a very small penalty
Penalty for hitting Obstacle (Large)
Reaching Goal
if derivative of disatance to goal is less than 0 its absoulte value is given as reward with a gain( rewarding the agent to maximize it velocity in the direction of the Goal)
minor step penalty
Termination Criteria:
If hit obstacle
If reached goal
Create the agent options object
agentOptions = rlDDPGAgentOptions();
% specify the options
agentOptions.SampleTime = Ts; %sampling time of 0.025 and final time of 25
agentOptions.MiniBatchSize = 256;
agentOptions.ExperienceBufferLength = 1e6;
agentOptions.MaxMiniBatchPerEpoch = 200;
% optimizer options
agentOptions.ActorOptimizerOptions.LearnRate = 1e-3;
agentOptions.ActorOptimizerOptions.GradientThreshold = 1;
agentOptions.CriticOptimizerOptions.LearnRate = 1e-3;
agentOptions.CriticOptimizerOptions.GradientThreshold = 1;
% exploration options
agentOptions.NoiseOptions.StandardDeviation = 0.15;
agentOptions.NoiseOptions.MeanAttractionConstant = 0.15;
initOpts = rlAgentInitializationOptions(NumHiddenUnit=256);
UAVQuadrotor = rlDDPGAgent(obsInfo,actInfo,initOpts,agentOptions);
Check out the result of "emoji matrix" multiplication below.
- vector multiply vector:
a = ["😁","😁","😁"]
b = ["😂";
"😂"
"😂"]
c = a*b
- matrix multiply matrix:
matrix1 = [
"😀", "😃";
"😄", "😁"]
matrix2 = [
"😆", "😅";
"😂", "🤣"]
resutl = matrix1*matrix2
enjoy yourself!
what is the new modification for matlab 2024 and 2023b version , some of my code is showing error?
2024a版本下的runtime进行complier程序封装后,封装后的程序怎么在win7系统上使用?会显示很多不兼容问题,需要配置很多dll文件,能不能在封装时候就解决这些问题。
在分类学习器中,点击特征选择,页面就会一直停留在正在打开特征选择选项。然后命令行窗口会出现警告。警告的内容为警告: 执行为类 mlearnapp.internal.ui.toolstrip.GenericButtonView 定义的事件 Clicked 的侦听程序回调时出现错误:
错误使用 normalize
输入参数太多。
In the classification learner, click Feature Selection and the page will stay with the feature selection option open. A warning will then appear in the command line window. Warning for warning: the contents of execution for the class mlearnapp. Internal. UI. Toolstrip. GenericButtonView defined event Clicked listener error correction:
Use normalize incorrectly
Too many input parameters.
I am looking for a Simulink tutor to help me with Reinforcement Learning Agent integration. If you work for MathWorks, I am willing to pay $30/hr. I am working on a passion project, ready to start ASAP. DM me if you're interested.
Bitte um Hilfe beim Kauf
Since May 2023, MathWorks officially introduced the new Community API(MATLAB Central Interface for MATLAB), which supports both MATLAB and Node.js languages, allowing users to programmatically access data from MATLAB Answers, File Exchange, Blogs, Cody, Highlights, and Contests.
I’m curious about what interesting things people generally do with this API. Could you share some of your successful or interesting experiences? For example, retrieving popular Q&A topics within a certain time frame through the API and displaying them in a chart.
If you have any specific examples or ideas in mind, feel free to share!
您也可以从以下列表中选择网站:
美洲
- América Latina (Español)
- Canada (English)
- United States (English)
欧洲
- Belgium (English)
- Denmark (English)
- Deutschland (Deutsch)
- España (Español)
- Finland (English)
- France (Français)
- Ireland (English)
- Italia (Italiano)
- Luxembourg (English)
- Netherlands (English)
- Norway (English)
- Österreich (Deutsch)
- Portugal (English)
- Sweden (English)
- Switzerland
- United Kingdom(English)
亚太
- Australia (English)
- India (English)
- New Zealand (English)
- 中国
- 日本Japanese (日本語)
- 한국Korean (한국어)