Results for
- Change an answer to a comment
- Change an answer with comments to a group of comments
- Change a comment to an answer
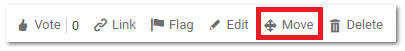
- Move a comment
- Date: 7/14 at 11am
- Link: https://youtu.be/ViI01KNIMh4

20 minutes makes a difference
I struggled to learn MATLAB at first. A colleague at my university gave me about 20 minutes of his time to show me some basic features, how to reference the documentation, and how to debug code. That was enough for me to start using MATLAB independently. After a few semesters of developing analyses and visualizations, I started answering questions in the forum when I had time. I became addicted to volunteering and learning from the breadth of analytical problems the forum exposed me to.
Have you ever solved a problem using a MathWorks product?
If your answer is YES, you may be the right person to help someone looking for guidance to solve a similar problem. Some answers in the MATLAB Central community forum maintain 1000s of views per month and some files on the File Exchange have 1000s of downloads. Volunteering a moment of your time to answer a question or to share content to the File Exchange may benefit countless individuals in the near and distant future and you will likely learn a lot by contributing too!
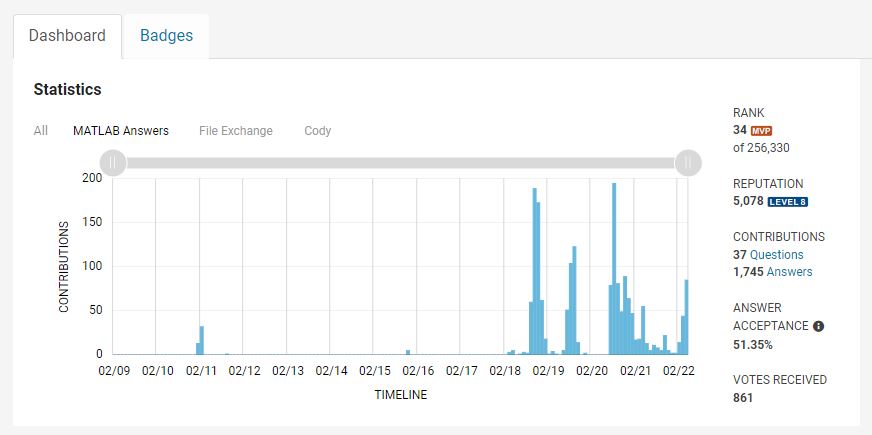
- 3616 questions were asked last month in the forum and in that time, 747 volunteers answered at least one question!
- 62% of those volunteers were first-time contributors!
- 335 volunteer contributors shared content in the File Exchange last month!
- 1: the number of contributions it takes to make a difference.
This week is National Volunteer Week in the USA (April 17-23). Challenge yourself and your colleagues by committing to help a stranger break barriers in their path to learning MATLAB.
How to volunteer and contribute to the MATLAB Central Community
Here are two easy ways to accept the volunteer challenge.
Contribute to the MATLAB Answers Forum
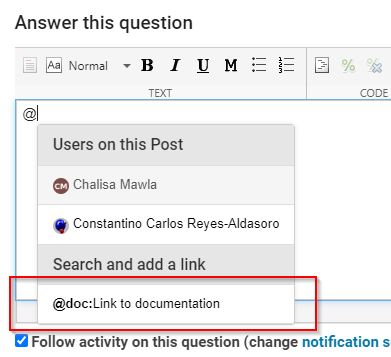
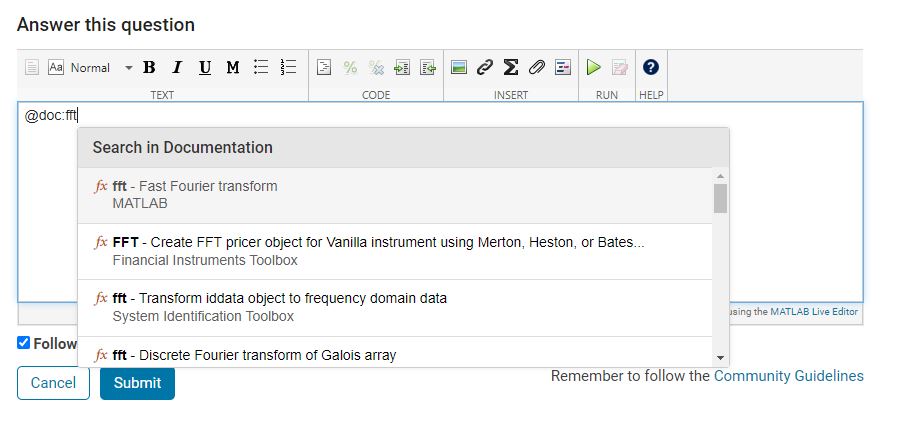
- Go to the MATLAB Answers repository. This page shows all unanswered questions starting with the most recent question. Use the filters on the left to see answered questions or questions belonging to a specific category. Alternatively, search for questions using keywords in the search field or visit the landing page.
- Open a few questions that interest you based on the question titles and tags.
- Decide how you'd like to contribute. Sometimes a question needs refinement or requires a bit of work to address. Decide whether to leave a comment that guides the user in the right direction, answer the question, or skip to the next question. The decision tree below is how some experienced contributors approach these decisions.
Pro tips
- Newer questions have more traffic and are often answered within an hour or minutes.
- Multiple answers often add valuable alternative perspectives and solutions.
- Sometimes answers aren't accepted or the asker disappears. Be not discouraged. Your answer holds much value.
Contribute to the File Exchange
- Choose a function, script, demo, or toolbox you created that may be helpful to the community.
- Go to the MathWorks File Exchange. Search for submissions that are similar to your idea and decide whether your idea adds value.
- Prepare your code for open-source sharing. The best submissions include brief documentation that explains the purpose of the code, inputs, expected outputs and limitations.
- Use the "Publish your code" button from the link above. This will guide you through the submission process.
Make a difference
No matter what level you are at as a MATLAB developer, you have skills that others around you could benefit from learning. Take the challenge and become a giant.
Let us know about your experience with MATLAB Central volunteers or your experience becoming a MATLAB Central volunteer in the comments below!

- It's free.
- It's online.
- Registration is now open.
- AI in Engineering
- Modeling and Simulation
- Implementation and DevOps
- Algorithm Development and Deployment
- 5G, Wireless, and Radar
- Autonomous Systems and Robotics
- Electrification, Motor Control, and Power Systems
- Preparing Future Engineers

.
MATLAB R2022a provides app developers more control over user navigation through app components using the keyboard's Tab key.
Part 1. The new focus function: programmatically set keyboard focus to a UI component
Part 2. Modify focus order of components
Today we'll review Part 2. See yesterday's Community Highlight for Part 1.
-------------------------------------------------------------------------------------------------
Well-designed apps have an obvious flow through interactive fields and, as we learned yesterday, using the Tab key to move the focus to the next UI component is faster and more efficient than using a mouse. Here we'll learn how to read and set the tab order of UI components in an app.
Understanding tab and stacking order
By default, tab order in MATLAB apps is controlled by the stacking order in the Component Browser. Initially, the stacking order within the component browswer is based on the sequence in which the objects were added to the container object within the app. MATLAB R2020b gave us control to edit the stacking order by selecting a component and using either the Reorder tool from the Canvas toolstrip or by right-clicking the component and selecting Reorder from the context menu [1]. Tab order flows from bottom to top through the Component Browswer hierarchy for objects that are focusable. Sending a component backward within the stack sets its tab order to earlier relative to other components.
Setting tab focus order in R2022a
Three additional tab order features were added in MATLAB R2022a that make it easier to control app navigation with the Tab key.
1. Sort and Filter by Tab Order : Instead of using the Reorder tool which lists components in reverse tab-order and includes components that are not focusable, filter the list by focusable components and sort them by tab-order using the View dropdown menu within the Component Browser (label 1 in image below). From here, you can drag and drop components to set their tab (and stacking) order.
2. Auto Tab Order : To automatically sort focusable components within your app so that the tab order is from left-to-right and then top-to-bottom, in App Designer, from Design View, select the Canvas tab > Tab Order button > Apply Auto Tab Order (label 2 in image below). Alternatively, you can apply auto tab order to components within a container such as a uipanel or uitab by right-clicking on the container within the Component Browser and selecting Apply Auto Tab Order.
3. Visualize Tab Order : You no longer have to read and interpret the handle names in the component browser to understand the current tab order of UI components. Instead, view an animation of tab order within App Designer. From Design View, select the Canvas tab > Tab Order button > Visualize Tab Order (label 3 in image below).
.
Contextual focus control: the power of combining focus() with setting tab order
Yesterday's Community Highlight showed how to programmatically set UI component focus using the focus(c) function. This, combined with control of tab order, allows app developers to implement contextual focus control. For example, when a radio button is selected in the GIF below, the corresponding UI Tab is selected programmatically and the keyboard focus is set to the first component within the UI Tab thus allowing the user to smoothly continue keyboard navigation. This is achieved by a callback function that responds to changes in the Button Group that sets the SelectedTab property of the TabGroup and uses the new focus() function. For details, see the attached focusAndTabOrderDemo.mlapp.
-------------------------------------------------------------------------------------------------
Stay tuned
Follow Community Highlights to get notifications for new content.
Let us know what interests you in the new MATLAB R2022a release in the comment section below.
See also
- MATLAB documentation: Modify Tab Focus Order of Components
- Release notes: Modify tab focus order
- R2021a Highlight: keyboard shortcuts for UI Components
- Download the latest release of MATLAB
Footnotes
[1] R202b release notes: change the stacking order of UI components
This Community Highlight is attached as a live script.
.
MATLAB R2022a provides app developers more control over user navigation through app components using the keyboard's Tab key.
Part 1. The new focus function: programmatically set keyboard focus to a UI component
Part 2. Modify focus order of components
Today we'll review Part 1. Come back tomorrow for Part 2.
-------------------------------------------------------------------------------------------------
Programmatically set UI component focus
Did you know that you can save ~2 seconds every time you use a keyboard shortcut rather than reaching for your mouse [1,2]?
I need you to focus here: starting in MATLAB R2022a, use the new focus function to set keyboard focus to a specific UI component.
By specifying the component handle ( c ) in focus(c),
- The figure containing the component is displayed
- A blue frame appears around the component
- The user can directly interact with the component.
.
Which components are focusable?
Focusable components are those that a user can interact with using the keyboard. So an object set to Enable='off' or Visible='off' cannot be in focus. See the documentation for more details.
What will you do with all of that extra time saved?
-------------------------------------------------------------------------------------------------
Stay tuned
Tomorrow we'll learn how to apply the new focus function with control of tab order to create contextual flow of UI component focus. Follow Community Highlights to get notifications.
Let us know what interests you in the new MATLAB R2022a release in the comment section below.
See also
- Release notes: focus
- R2021a Highlight: keyboard shortcuts for UI Components
- Download the latest release of MATLAB
Footnotes
[1] Lane et. al. (2005). International Journal of Human-Computer Interaction, 18(2).
[2] Michels (2018). median.com
This Community Highlight is attached as a live script.
您也可以从以下列表中选择网站:
美洲
- América Latina (Español)
- Canada (English)
- United States (English)
欧洲
- Belgium (English)
- Denmark (English)
- Deutschland (Deutsch)
- España (Español)
- Finland (English)
- France (Français)
- Ireland (English)
- Italia (Italiano)
- Luxembourg (English)
- Netherlands (English)
- Norway (English)
- Österreich (Deutsch)
- Portugal (English)
- Sweden (English)
- Switzerland
- United Kingdom(English)
亚太
- Australia (English)
- India (English)
- New Zealand (English)
- 中国
- 日本Japanese (日本語)
- 한국Korean (한국어)