搜索
Our MathWorks Usability Team is working on an accessibility project and they want to interview people who use MATLAB and also have experience with screen readers.
If you fit the criteria and are interested, sign up here https://www.mathworks.com/products/usability.html?tfa_30=A11Y
I wish I knew more about the intended evolution of the capabilities of the function arguments block. I love implementing function syntaxes using this relatively new form, but it doesn't yet handle some function syntax design patterns that I think are valuable and worth keeping.
For example, some functions take an input quantity that can something numeric, or it can be an option string that descriptively names a particular value of that quantity. One example is dateshift(t,"dayofweek",dow), where dow can be an integer from 1 to 7, or it can be one of the option strings "weekday" or "weekend".
Another example is Image Processing Toolbox that take a connectivity specifier as input. The function bwconncomp is one particular case. Connectivity can be specified using certain scalars, certain arrays, or the option string "maximal".
I think this is a worthwhile function design pattern, but I don't think the arguments block validation functionality supports it well (unless you use a lot of extra code that duplicates standard MATLAB behavior, which undermines the value of the arguments block).
MathWorkers - believe me, I know that it is not in your DNA to discuss future features. But would anyone care to offer a hint about directions for the arguments block functionality?

Christmas season is underway at my house:

(Sorry - the ornament is not available at the MathWorks Merch Shop -- I made it with a 3-D printer.)
At the present time, the following problems are known in MATLAB Answers itself:
- Symbolic output is not displaying. The work-around is to disp(char(EXPRESSION)) or pretty(EXPRESSION)
- Symbolic preferences are sometimes set to non-defaults
Hello, MATLAB fans!
For years, many of you have expressed interest in getting your hands on some cool MathWorks merchandise. I'm thrilled to announce that the wait is over—the MathWorks Merch Shop is officially open!
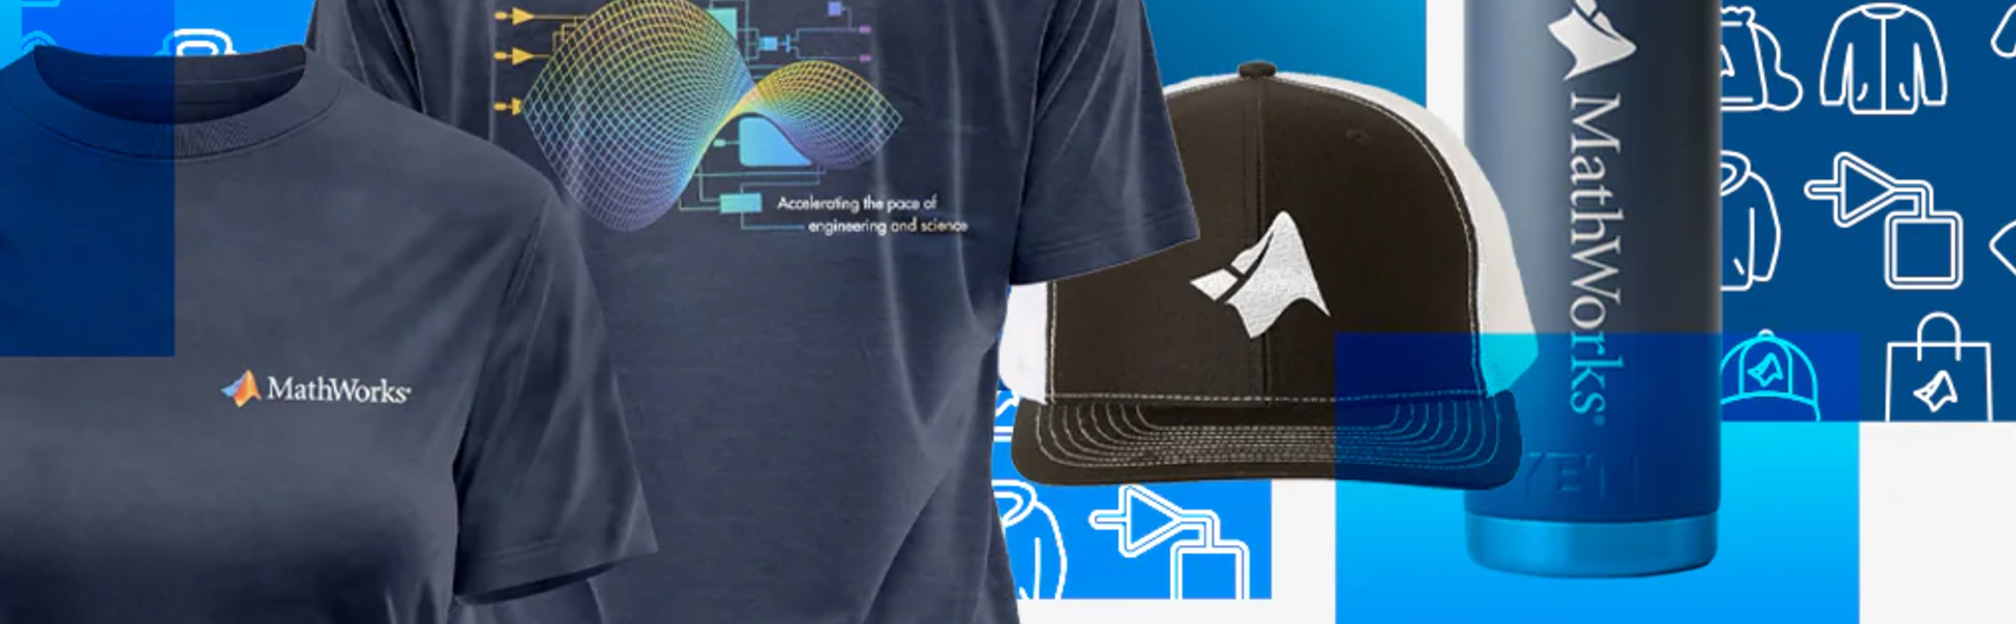
In our shop, you'll find a variety of exciting items, including baseball caps, mugs, T-shirts, and YETI bottles.
Visit the shop today and explore all the fantastic merchandise we have to offer. Happy shopping!
Just shared an amazing YouTube video that demonstrates a real-time PID position control system using MATLAB and Arduino.
I don't like the change
16%
I really don't like the change
29%
I'm okay with the change
24%
I love the change
11%
I'm indifferent
11%
I want both the web & help browser
11%
38 个投票
We are thrilled to announce the grand prize winners of our MATLAB Shorts Mini Hack contest! This year, we invited the MATLAB Graphics and Charting team, the authors of the MATLAB functions used in every entry, to be our judges. After careful consideration, they have selected the top three winners:
Judge comments: Realism & detailed comments; wowed us with Manta Ray
2nd place – Jenny Bosten
Judge comments: Topical hacks : Auroras & Wind turbine; beautiful landscapes & nightscapes
3rd place - Vasilis Bellos
Judge comments: Nice algorithms & extra comments; can’t go wrong with Pumpkins
Judge comments: Impressive spring & cubes!
In addition, after validating the votes, we are pleased to announce the top 10 participants on the leaderboard:
Congratulations to all! Your creativity and skills have inspired many of us to explore and learn new skills, and make this contest a big success!

You can make a lot of interesting objects with matlab primitive shapes (e.g. "cylinder," "sphere," "ellipsoid") by beginning with some of the built-in Matlab primitives and simply applying deformations. The gif above demonstrates how the Manta animation was created using a cylinder as the primitive and successively applying deformations: (https://www.mathworks.com/matlabcentral/communitycontests/contests/8/entries/16252);
Similarly, last year a sphere was deformed to create a face in two of my submissions, for example, the profile in "waking":
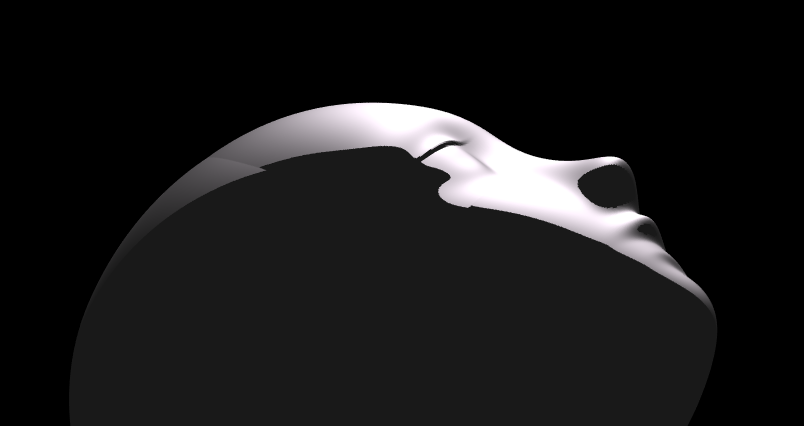
You can piece-wise assemble images, but one of the advantages of creating objects with deformations is that you have a parametric representation of the surface. Creating a higher or lower polygon rendering of the surface is as simple as declaring the number of faces in the orignal primitive. For example here is the scene in "snowfall" using sphere with different numbers of input faces:
sphere(100)

sphere(500)

High poly models aren't always better. Low-polygon shapes can sometimes add a little distance from that low point in the uncanny valley.
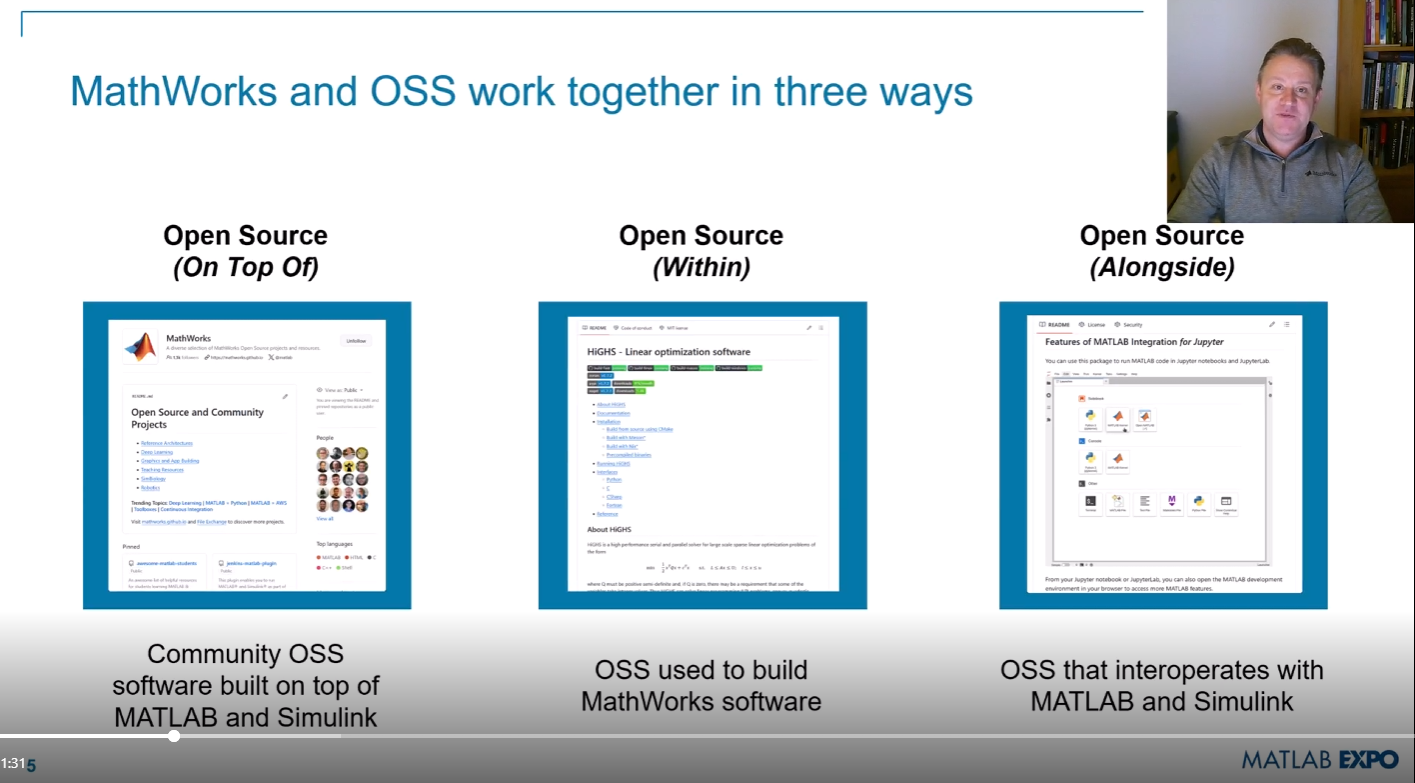
Next week is MATLAB EXPO week and it will be the first one that I'm presenting at! I'll be giving two presentations, both of which are related to the intersection of MATLAB and open source software.
- Open Source Software and MATLAB: Principles, Practices, and Python Along with MathWorks' Heather Gorr. We we discuss three different types of open source software with repsect to their relationship to MATLAB
- The CLASSIX Story: Developing the Same Algorithm in MATLAB and Python Simultaneously A collaboration with Prof. Stefan Guettel from University of Manchester. Developing his clustering algorithm, CLASSIX, in both Python and MATLAB simulatenously helped provide insights that made the final code better than if just one language was used.
There are a ton of other great talks too. Come join us! (It's free!) MATLAB EXPO 2024
Hi MATLAB Central community! 👋
I’m currently working on a project where I’m integrating MATLAB analytics into a mobile app, mainly to handle data-heavy tasks like processing sensor data and running predictive models. The app is built for Android, and while it’s not entirely MATLAB-based, I use MATLAB for a lot of data preprocessing and model training.
I wanted to reach out and see if anyone else here has experience with using MATLAB for similar mobile or embedded applications. Here are a few areas I’m focusing on:1. Optimizing MATLAB Code for Mobile Compatibility
I’ve found that some MATLAB functions work perfectly on desktop but may run slower or encounter limitations on mobile. I’ve tried using code generation and reducing function calls where possible, but I’m curious if anyone has other tips for optimizing MATLAB code for mobile environments?
2. Using MATLAB for Sensor Data Processing
I’m working with accelerometer and GPS data, and MATLAB has been great for preprocessing. However, I wonder if anyone has suggestions for handling large sensor datasets efficiently in MATLAB, especially if you've managed data in mobile contexts?
3. Integrating MATLAB Models into Mobile Apps
I’ve heard about using MATLAB Compiler SDK to integrate MATLAB algorithms into other environments. For those who have done this, what’s the best way to maintain performance without excessive computational strain on the device?
4. Data Visualization Tips
Has anyone had experience with mobile-friendly data visualizations using MATLAB? I’ve been using basic plots, but I’d love to know if there are any resources or toolboxes that make it easier to create lightweight, interactive visuals for mobile.
If anyone here has tips, tools, or experiences with MATLAB in mobile development, I’d love to hear them! Thanks in advance for any advice you can share!
Dear MATLAB contest enthusiasts,
Welcome to the third installment of our interview series with top contest participants! This time we had the pleasure of talking to our all-time rock star – @Jenny Bosten. Every one of her entries is a masterpiece, demonstrating a deep understanding of the relationship between mathematics and aesthetics. Even Cleve Moler, the original author of MATLAB, is impressed and wrote in his blog: "Her code for Time Lapse of Lake View to the West shows she is also a wizard of coordinate systems and color maps."
you to read it to learn more about Jenny’s journey, her creative process, and her favorite entries.
Question: Who would you like to see featured in our next interview? Let us know your thoughts in the comments!
It would be nice to have a function to shade between two curves. This is a common question asked on Answers and there are some File Exchange entries on it but it's such a common thing to want to do I think there should be a built in function for it. I'm thinking of something like
plotsWithShading(x1, y1, 'r-', x2, y2, 'b-', 'ShadingColor', [.7, .5, .3], 'Opacity', 0.5);
So we can specify the coordinates of the two curves, and the shading color to be used, and its opacity, and it would shade the region between the two curves where the x ranges overlap. Other options should also be accepted, like line with, line style, markers or not, etc. Perhaps all those options could be put into a structure as fields, like
plotsWithShading(x1, y1, options1, x2, y2, options2, 'ShadingColor', [.7, .5, .3], 'Opacity', 0.5);
the shading options could also (optionally) be a structure. I know it can be done with a series of other functions like patch or fill, but it's kind of tricky and not obvious as we can see from the number of questions about how to do it.
Does anyone else think this would be a convenient function to add?
Over the past 4 weeks, 250+ creative short movies have been crafted. We had a lot of fun and, more importantly, learned new skills from each other! Now it’s time to announce week 4 winners.
Nature:
3D:
Seamless loop:
Holiday:
Fractal:
Congratulations! Each of you won your choice of a T-shirt, a hat, or a coffee mug. We will contact you after the contest ends.
Weekly Special Prizes
Thank you for sharing your tips & tricks with the community. These great technical articles will benefit community users for many years. You won a limited-edition pair of MATLAB Shorts!
In week 5, let’s take a moment to sit back, explore all of the interesting entries, and cast your votes. Reflect what you have learned or which entries you like most. Share anything in our Discussions area! There is still time to win our limited-edition MATLAB Shorts.
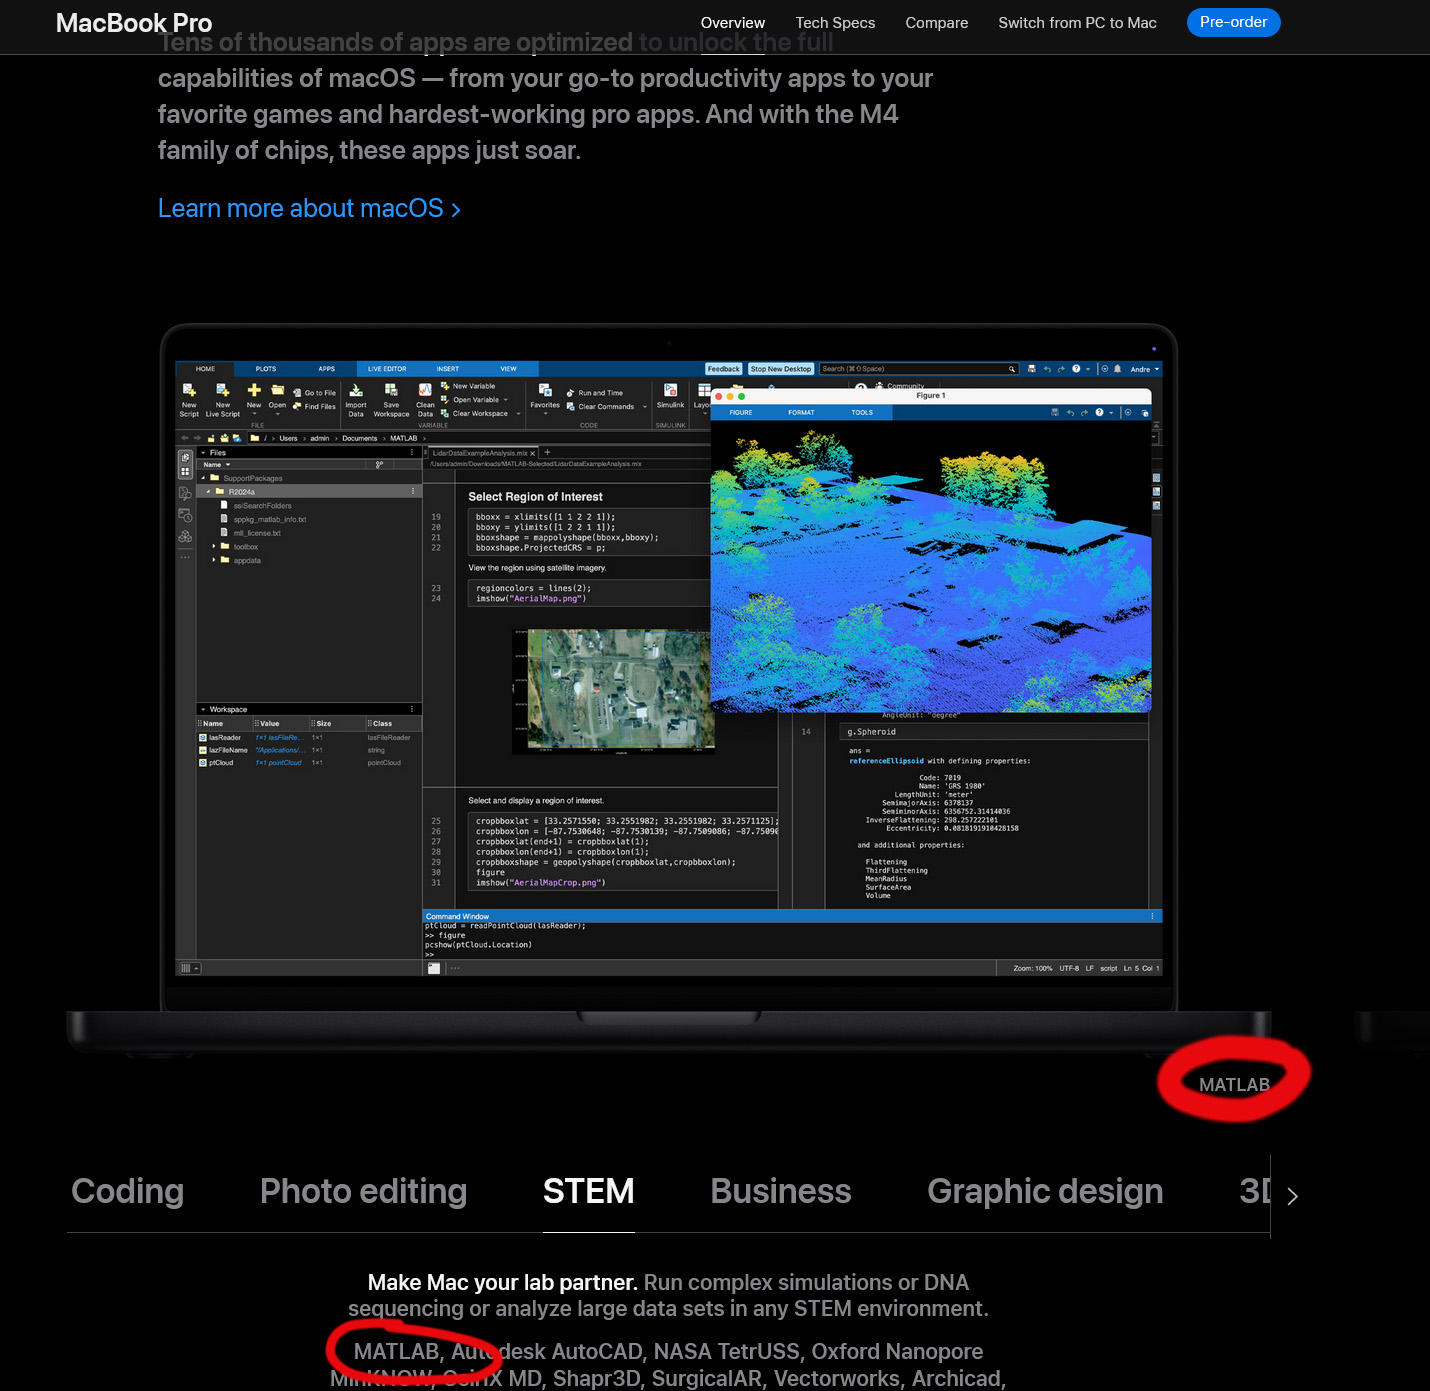
Go to this page, scroll down to the middle of the long page where you see "Coding Photo editing STEM Business ...." and select "STEM". Voilà!
In the past two years, large language models have brought us significant changes, leading to the emergence of programming tools such as GitHub Copilot, Tabnine, Kite, CodeGPT, Replit, Cursor, and many others. Most of these tools support code writing by providing auto-completion, prompts, and suggestions, and they can be easily integrated with various IDEs.
As far as I know, aside from the MATLAB-VSCode/MatGPT plugin, MATLAB lacks such AI assistant plugins for its native MATLAB-Desktop, although it can leverage other third-party plugins for intelligent programming assistance. There is hope for a native tool of this kind to be built-in.
Mini Hack is brilliant!Let's use MATLAB to create the future!