搜索
Cordial saludo , Necesito simular un generador electrico que tiene una entrada mecanica y genera el suficiente voltage y corriente para encender un LED.
Drumlin Farm has welcomed MATLAMB, named in honor of MathWorks, among ten adorable new lambs this season!

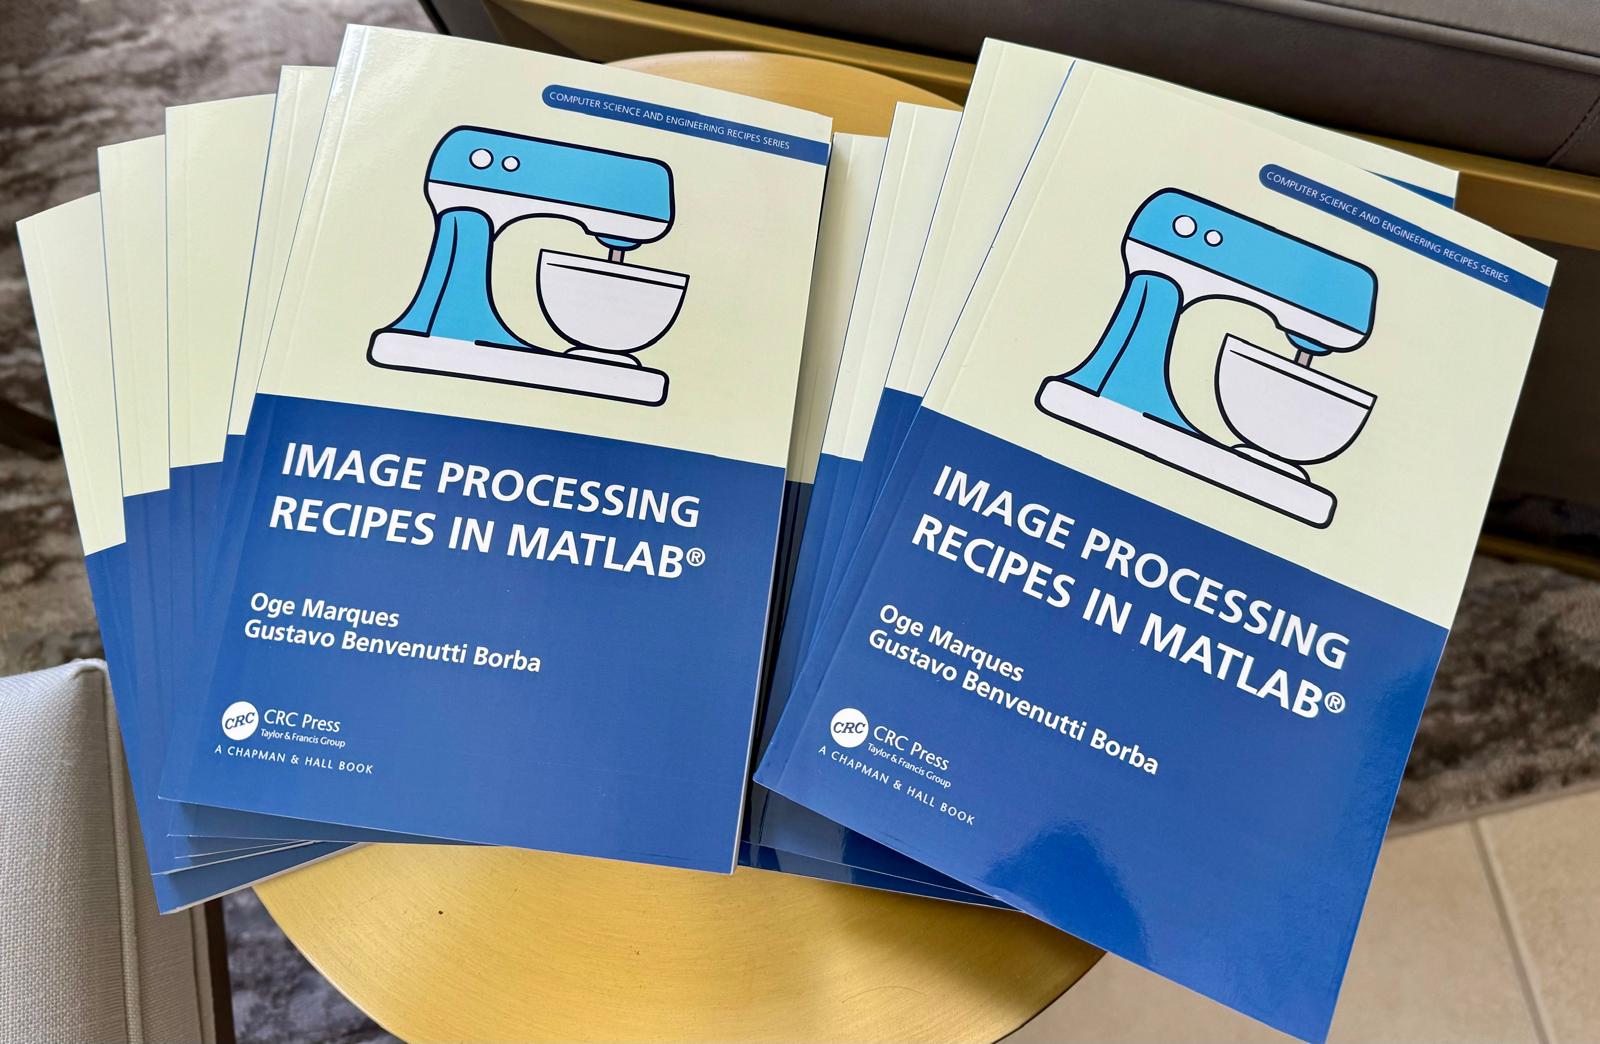
📚 New Book Announcement: "Image Processing Recipes in MATLAB" 📚
I am delighted to share the release of my latest book, "Image Processing Recipes in MATLAB," co-authored by my dear friend and colleague Gustavo Benvenutti Borba.
This 'cookbook' contains 30 practical recipes for image processing, ranging from foundational techniques to recently published algorithms. It serves as a concise and readable reference for quickly and efficiently deploying image processing pipelines in MATLAB.
Gustavo and I are immensely grateful to the MathWorks Book Program for their support. We also want to thank Randi Slack and her fantastic team at CRC Press for their patience, expertise, and professionalism throughout the process.
___________
A colleague said that you can search the Help Center using the phrase 'Introduced in' followed by a release version. Such as, 'Introduced in R2022a'. Doing this yeilds search results specific for that release.
Seems pretty handy so I thought I'd share.
Are you local to Boston?
Shape the Future of MATLAB: Join MathWorks' UX Night In-Person!
When: June 25th, 6 to 8 PM
Where: MathWorks Campus in Natick, MA
🌟 Calling All MATLAB Users! Here's your unique chance to influence the next wave of innovations in MATLAB and engineering software. MathWorks invites you to participate in our special after-hours usability studies. Dive deep into the latest MATLAB features, share your valuable feedback, and help us refine our solutions to better meet your needs.
🚀 This Opportunity Is Not to Be Missed:
- Exclusive Hands-On Experience: Be among the first to explore new MATLAB features and capabilities.
- Voice Your Expertise: Share your insights and suggestions directly with MathWorks developers.
- Learn, Discover, and Grow: Expand your MATLAB knowledge and skills through firsthand experience with unreleased features.
- Network Over Dinner: Enjoy a complimentary dinner with fellow MATLAB enthusiasts and the MathWorks team. It's a perfect opportunity to connect, share experiences, and network after work.
- Earn Rewards: Participants will not only contribute to the advancement of MATLAB but will also be compensated for their time. Plus, enjoy special MathWorks swag as a token of our appreciation!
👉 Reserve Your Spot Now: Space is limited for these after-hours sessions. If you're passionate about MATLAB and eager to contribute to its development, we'd love to hear from you.

Bringing the beauty of MathWorks Natick's tulips to life through code!
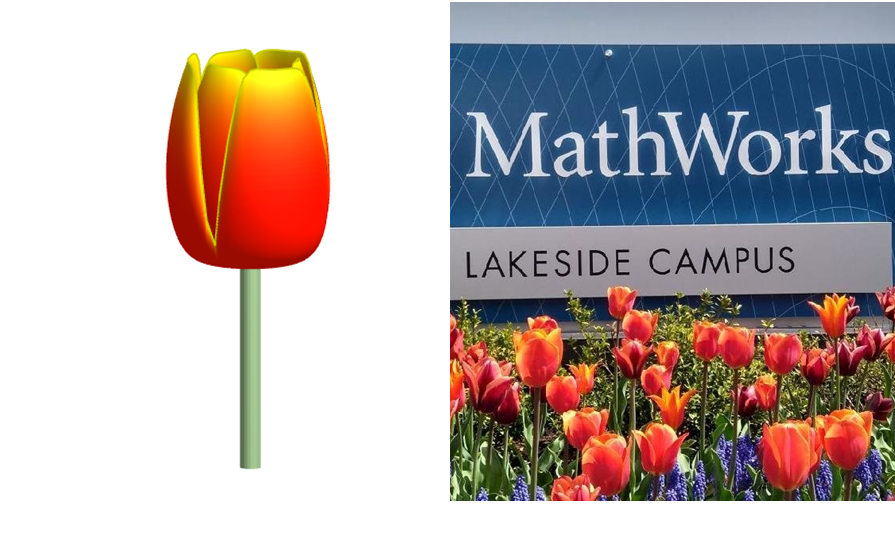
Remix challenge: create and share with us your new breeds of MATLAB tulips!
Hello MATLAB community,
I am doing some image processing with MATLAB and some issues with my coding. I just like to warn you that I am very new at coding and MATLAB so I apologise in advance for my low level and I would be very glad to have some help as I have hitted a wall, and can't find a solution to my problem.
Context: I have a video of beams, that move right to left over time. The base is fixed, only the beam moves. I converted the video to images, and my MATLAB program is going through the image file and treating every image in it. Here are two image examples:
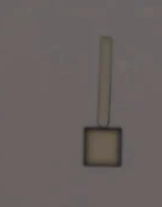 and
and 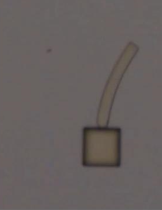
I want to measure the following things:
a. The coordinates between the 2 extremities of the beam (length of the beam, without its base), let's call them A and B.
b. The bending deformation E (L0-Lt/L0 *100), obtained by calculating the distance between A and B, called Lt.
c. the curvature of the beam (1/R), obtained by extracting the radius R of a circle fitting the curvature of the beam.
d. The angle between a vertical line passing through A, and the line AB.
What I have done so far:
My approach has been to transform my image into an rgbimage, then binaryImage, then have the complementary image, apply some modifications/corrections to the image, and then skeletonize it. And from then, I extract the coordinates of A and B, the distance between A&B (Lt), the radius of the beam R, and the angle between A&B (T).
My main issue is the skeletonisation. Because my beam is quite thick, it shortens up too much my beam, and in an inconcistent manner. So then my results are completly wrong. Here is an image of the different images and operation I have done and the result:
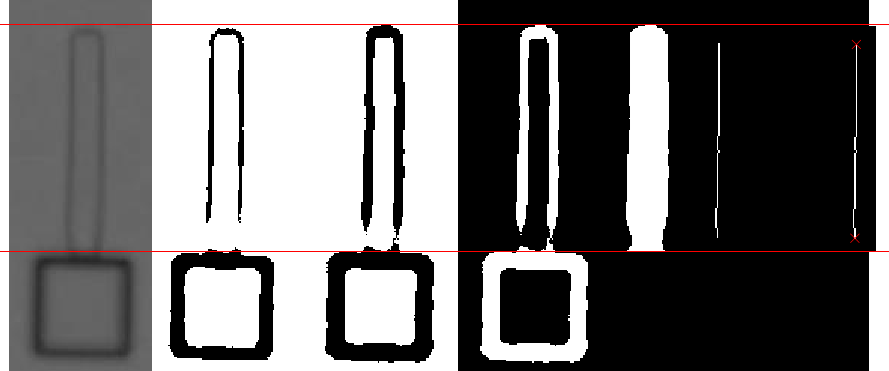
So as you can see, the length is shorter. I would like to have a skeleton that meets the edges of the beam to calculate the end points.
I have tried "bwskel(BW, 'MinBranchLength', 30)" and "bwmorph(BW, 'thin', inf)", and this: https://uk.mathworks.com/matlabcentral/fileexchange/11123-better-skeletonization. But the problem remains the same. I have tried regionpropos, but the major axis they return is too long, I have tried bwferet(), but the maxlength is in diagonal of the beam... I have running out of ideas.
Problem: So I guess my main problem is how can I get a skeletonisation that goes to the edges of the beam?
Here is my code:
for i = TrackingStart:TrackingEnd
FileRGB(:,:,i) = rgb2gray(imread(IMG)); % Convert to grayscale
croppedRGB = FileRGB(y3left:y3right, x3left:x3right, i);
binaryImage = imbinarize(croppedRGB, 'adaptive', 'ForegroundPolarity','dark','Sensitivity', 0.50);
out = nnz(~binaryImage);
while out <= 4300 % Change threshold if needed
for j = 1:50
sensitivity = 0.50 + j * 0.01;
binaryImage = imbinarize(croppedRGB, 'adaptive', 'ForegroundPolarity', 'dark', 'Sensitivity', sensitivity);
out = nnz(~binaryImage);
if out >= 4325
break; % Exit the loop if the condition is met
end
end
end
% Create a line Model
BW = imcomplement(binaryImage);
BW(y1left:y1right, x1left:x1right) = 1; % there is always sample at the junction area (between beam and base)
BW(y2left:y2right, x2left:x2right) = 0; % Always = 0 if no sample here
BW = bwmorph(BW, 'close', Inf);
BW = bwmorph(BW, 'bridge');
BW = bwareafilt(BW, 1);
s = regionprops(BW, 'FilledImage');
BW = s.FilledImage;
BW = bwskel(BW, 'MinBranchLength', 30);
endpoints = bwmorph(BW, 'endpoints');
[y_end, x_end] = find(endpoints == 1);
%Degree of bending deformation method
Lt = sqrt(power(x_end(1)-x_end(2),2)+power(y_end(1)-y_end(2),2));
if x_end(2) > x_end(1)
Lt = -Lt;
end
Lstore(i) = Lt;
%Curvature method
[row_dots_cir, col_dots_cir, val] = find(BW == 1);
[xc(i),yc(i),Rstore(i),a] = circfit(col_dots_cir,row_dots_cir);
%Angle method
slope_endpoints = (x_end(1) - x_end(2)) / (y_end(1) - y_end(2));
angle_radians = atan(slope_endpoints);
angle_degrees = rad2deg(angle_radians);
if x_end(2) > x_end(1)
angle_degrees = -angle_degrees;
end
Tstore(i) = angle_degrees;
i
end
I found this plot of words said by different characters on the US version of The Office sitcom. There's a sparkline for each character from pilot to finale episode.
I have question about using 'bnlssm' object when the problem involves time-varying coefs. Per this documentation https://www.mathworks.com/help/econ/bnlssm.html , bnlssm allows the transition matrix to be a nonlinear function of the past values of the state vector, while also being time-varying --, i.e. A_t(x_{t-1}). However the documentation contains an example of the parameter mapping function for a fixed coef. case only:
function [A,B,C,D,Mean0,Cov0,StateType] = paramMap(theta)
A = @(x)blkdiag([theta(1) theta(2); 0 1],[theta(3) theta(4); 0 1])*x;
B = [theta(5) 0; 0 0; 0 theta(6); 0 0];
C = @(x)log(exp(x(1)-theta(2)/(1-theta(1))) + ...
exp(x(3)-theta(4)/(1-theta(3))));
D = theta(7);
Mean0 = [theta(2)/(1-theta(1)); 1; theta(4)/(1-theta(3)); 1];
Cov0 = diag([theta(5)^2/(1-theta(1)^2) 0 theta(6)^2/(1-theta(3)^2) 0]);
StateType = [0; 1; 0; 1]; % Stationary state and constant 1 processes
end
Here, A and C are recognised as function handles and show the dimension of 1-by-1 when [A,B,C,D]=paramMap(theta) is run with a given theta. This does not prevent filter/smooth from returning the states estimates, as the function handles become m-by-m matices when the function handles are evaluated.
However, whenever I try replaceing A with a cell array, e.g.:
A=cell(T,1);
for t=1:T
A{t} = @(x)blkdiag([theta(1) theta(2); 0 1],[theta(3) theta(4); 0 1])*x;
end
bnlssm.fixcoeff throws an error that the dimensions of Mean0 are expected to be 1, per validation step in lines 700-707 of 'bnlssm.m':
if iscellA; At = A{1};
else; At = A; end
numStates0 = size(At,2);
if
isscalar(mean0)
mean0 = mean0(ones(numStates0,1),:);
elseif
~isempty(mean0)
mean0 = mean0(:);
validateattributes(mean0,{'numeric'},{'finite','real','numel',numStates0},callerName,'Mean0');
end
Q: Is it just overlook by MathWorks programmers and creating local verions of bnlssm/filter/smooth with that validation step removed is a viable pathway forward, or is it intentional because 'bnlssm' was in fact designed to handle only the time-invariant coef. case correctly?
is there any sites available online free ai course learning except: coursera.org
%%https://in.mathworks.com/matlabcentral/cody/problems/3-find-the-sum-of-all-the-numbers-of-the-input-vector/solutions/new#
%Above is the complete link of question that is ask and below i am providing my code for %this problem, please guide how do i rearrange this so that i can pass all the test at a time.
function y = vecsum(x)
x= 1:100;
y1= sum(x(1,[1]));
y2= sum(x(1,[1 2 3 5]));
y3= sum(x);
y=[y1 y2 y3];
end
Are you a Simulink user eager to learn how to create apps with App Designer? Or an App Designer enthusiast looking to dive into Simulink?
Don't miss today's article on the Graphics and App Building Blog by @Robert Philbrick! Discover how to build Simulink Apps with App Designer, streamlining control of your simulations!
Hi All,
I'm trying to get code coverage analysis report while cosimulation of generated HDL code through Questasim in Simulink. I'm getting blank results in coverage analysis section of Questasim. Can you please help me to get code coverage details ? Thanks in Advance.
Matlab: 2022b
Questasim: 2020.1
Northern lights captured from this weekend at MathWorks campus ✨
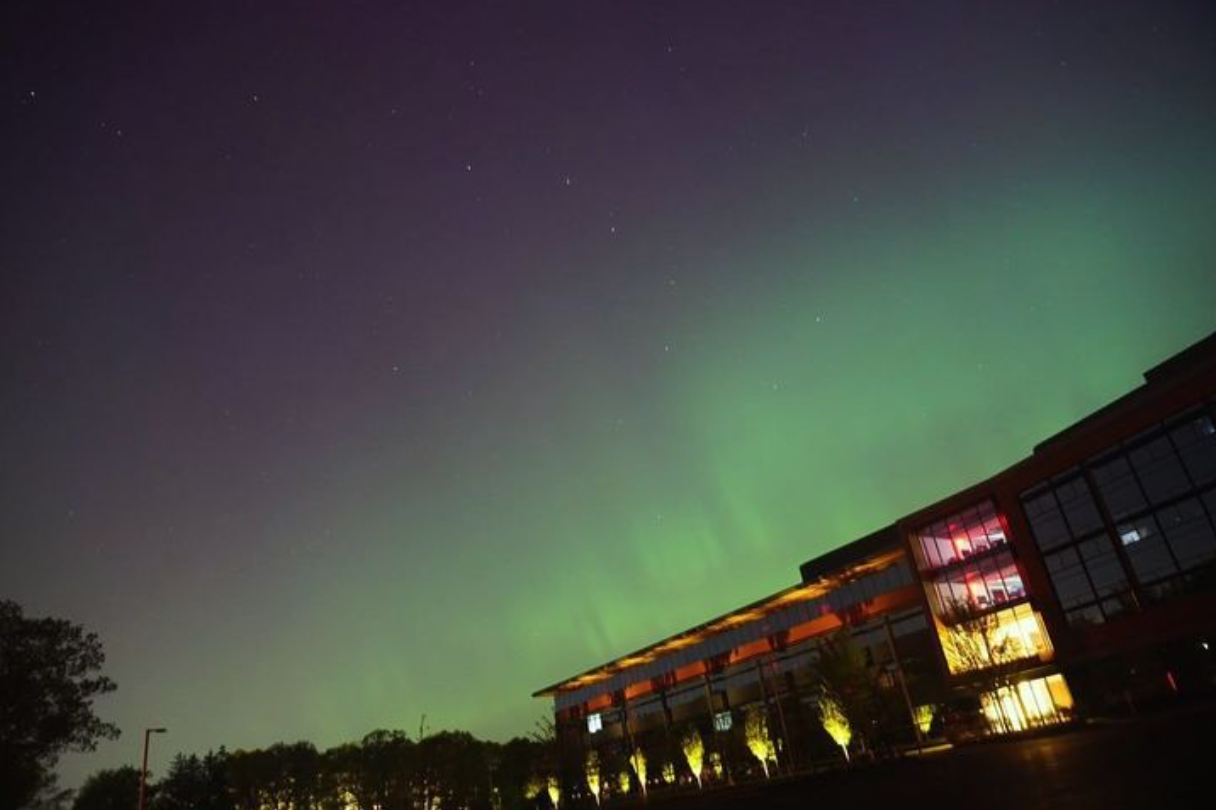
Did you get a chance to see lights and take some photos?
From Alpha Vantage's website: API Documentation | Alpha Vantage
Try using the built-in Matlab function webread(URL)... for example:
% copy a URL from the examples on the site
URL = 'https://www.alphavantage.co/query?function=TIME_SERIES_DAILY&symbol=IBM&apikey=demo'
% or use the pattern to create one
tickers = [{'IBM'} {'SPY'} {'DJI'} {'QQQ'}]; i = 1;
URL = ...
['https://www.alphavantage.co/query?function=TIME_SERIES_DAILY_ADJUSTED&outputsize=full&symbol=', ...
+ tickers{i}, ...
+ '&apikey=***Put Your API Key here***'];
X = webread(URL);
You can access any of the data available on the site as per the Alpha Vantage documentation using these two lines of code but with different designations for the requested data as per the documentation.
It's fun!

This cheat sheet is here:
reference:
- https://github.com/peijin94/matlabPlotCheatsheet
- https://github.com/mathworks/visualization-cheat-sheet
- https://www.mathworks.com/products/matlab/plot-gallery.html
- https://www.mathworks.com/help/matlab/release-notes.html
MATLAB used to have official visualization-cheat-sheet, but there have been quite a few new updates in MATLAB versions recently. Therefore, I made my own cheat sheet and marked the versions of each new thing that were released :


Hi to all.
I'm trying to learn a bit about trading with cryptovalues. At the moment I'm using Freqtrade (in dry-run mode of course) for automatic trading. The tool is written in python and it allows to create custom strategies in python classes and then run them.
I've written some strategy just to learn how to do, but now I'd like to create some interesting algorithm. I've a matlab license, and I'd like to know what are suggested tollboxes for following work:
- Create a criptocurrency strategy algorythm (for buying and selling some crypto like BTC, ETH etc).
- Backtesting the strategy with historical data (I've a bunch of json files with different timeframes, downloaded with freqtrade from binance).
- Optimize the strategy given some parameters (they can be numeric, like ROI, some kind of enumeration, like "selltype" and so on).
- Convert the strategy algorithm in python, so I can use it with Freqtrade without worrying of manually copying formulas and parameters that's error prone.
- I'd like to write both classic algorithm and some deep neural one, that try to find best strategy with little neural network (they should run on my pc with 32gb of ram and a 3080RTX if it can be gpu accelerated).
What do you suggest?
If structure is in the form of struct1.struct2(m,n).struct3. how to extract values present in struct3 using mex function
Dear MATLAB contest enthusiasts,
I believe many of you have been captivated by the innovative entries from Zhaoxu Liu / slanderer, in the 2023 MATLAB Flipbook Mini Hack contest.


Ever wondered about the person behind these creative entries? What drives a MATLAB user to such levels of skill? And what inspired his participation in the contest? We were just as curious as you are!
We were delighted to catch up with him and learn more about his use of MATLAB. The interview has recently been published in MathWorks Blogs. For an in-depth look into his insights and experiences, be sure to read our latest blog post: Community Q&A – Zhaoxu Liu.
But the conversation doesn't end here! Who would you like to see featured in our next interview? Drop their name in the comments section below and let us know who we should reach out to next!