主要内容
Results for
2
17%
3
12%
4
59%
6
4%
8
5%
Other (comment below)
3%
6419 个投票
In the MATLAB editor, when clicking on a variable name, all the other instances of the variable name will be highlighted.
But this does not work for structure fields, which is a pity. Such feature would be quite often useful for me.
I show an illustration below, and compare it with Visual Studio Code that does it. ;-)
I am using MATLAB R2023a, sorry if it has been added to newer versions, but I didn't see it in the release notes.

Dear members, I’m currently doing research on the subject of using Generative A.I. as a digital designer. What our research group would like to know is which ethical issues have a big impact on the decisions you guys and girls make using generative A.I.
Whether you’re using A.I. or not, we would really like to know your vision and opinion about this subject. Please empty your thoughts and oppinion into your answers, we would like to get as much information as possible.
Are you currently using A.I. when doing your job? Yes, what for. No (not yet), why not?
Using A.I., would you use real information or alter names/numbers to get an answer?
What information would or wouldn’t you use? If the client is asking/ordering you to do certain things that go against your principles, would you still do it because order is order? How far would you go?
Who is responsible for the outcome of the generated content, you or the client?
Would you still feel like a product owner if it was co-developed with A.I.?
What we are looking for is that we would like to know why people do or don’t use AI in the field of design and wich ethical considerations they make. We’re just looking for general moral line of people, for example: 70% of designers don’t feel owner of a design that is generated by AI but 95% feels owner when it is co-created.
So therefore the questions we asked, we want to know the how you feel about this.

Welcome to MATLAB Central's first Ask Me Anything (AMA) session! Over the next few weeks, I look forward to addressing any questions or curiosities you might have about MATLAB, the forum, sasquatches, or whatever's on your mind. Having volunteered as a contributor to this community before joining MathWorks, I'm excited to act as a bridge between these two worlds. Let's kick things off by sharing a little-known fact about the forum’s staff contributors!
A couple of years ago, before I joined MathWorks as a developer on the Graphics and Charting team, I often wondered who were the MathWorkers with the [staff] moniker answering questions in the Answers forum. Is their MATLAB Central activity part of their day-to-day job expectations? Do they serve specific roles on some kind of community outreach team? Is their work in the forum voluntary in the same way that non-staff contributors volunteer their time?
Now that I'm on the inside, I'd like to share a secret with my fellow MATLAB users and MATLAB Central enthusiasts: with the exception of the MathWorks Support Team, staff participation in the Answers forum is completely voluntary! The staff contributions you see in the forum arise from pure intrinsic motivation to connect with users, help people out of ruts, and spread the word about our product!
For example, Steven Lord has contributed 20-150 answers per month for 9 years! Steven is a quality engineer for core MATLAB numerical functions. Cris LaPierre develops training material and has been a faithful contributor in the forum for almost 6 years! Kojiro Saito and Akira Agata have been tackling Japanese content for more than 7 years! There are many others who have inspired me as a user, and I am honored to now call colleagues: Peter Perkins, Michio, Joss Knight, Alan Weiss, Jiro Doke, Edric Ellis, and many others who deserve appreciation.
The forum's success hinges on the invaluable contributions from the majority of non-staff volunteers, whose dedication and expertise fuel our community. But I know I wasn't alone in wondering about these staff contributors, so now you're in on the secret!
I'm curious to know what other topics you're interested in learning about. Ask me anything!
numel(v)
6%
length(v)
13%
width(v)
14%
nnz(v)
8%
size(v, 1)
27%
sum(v > 0)
31%
2537 个投票
We're thrilled to unveil a new feature in the MATLAB Central community: User Following.
Our community is so lucky to have many experienced MATLAB experts who generously share their knowledge and insights across different applications, including Answers, File Exchange, Discussions, Contests, or Blogs.
With the introduction of User Following feature, you can now easily track new content across different areas and engage in discussions with people you follow. Simply click the ‘Follow’ button located on their profile page to start.

Depending on your communication setting, you will receive notifications via email and/or view updates in your ‘Followed Activity’ feeds. To tailor your feed, select the ‘People’ filter and focus on activities from those you follow.
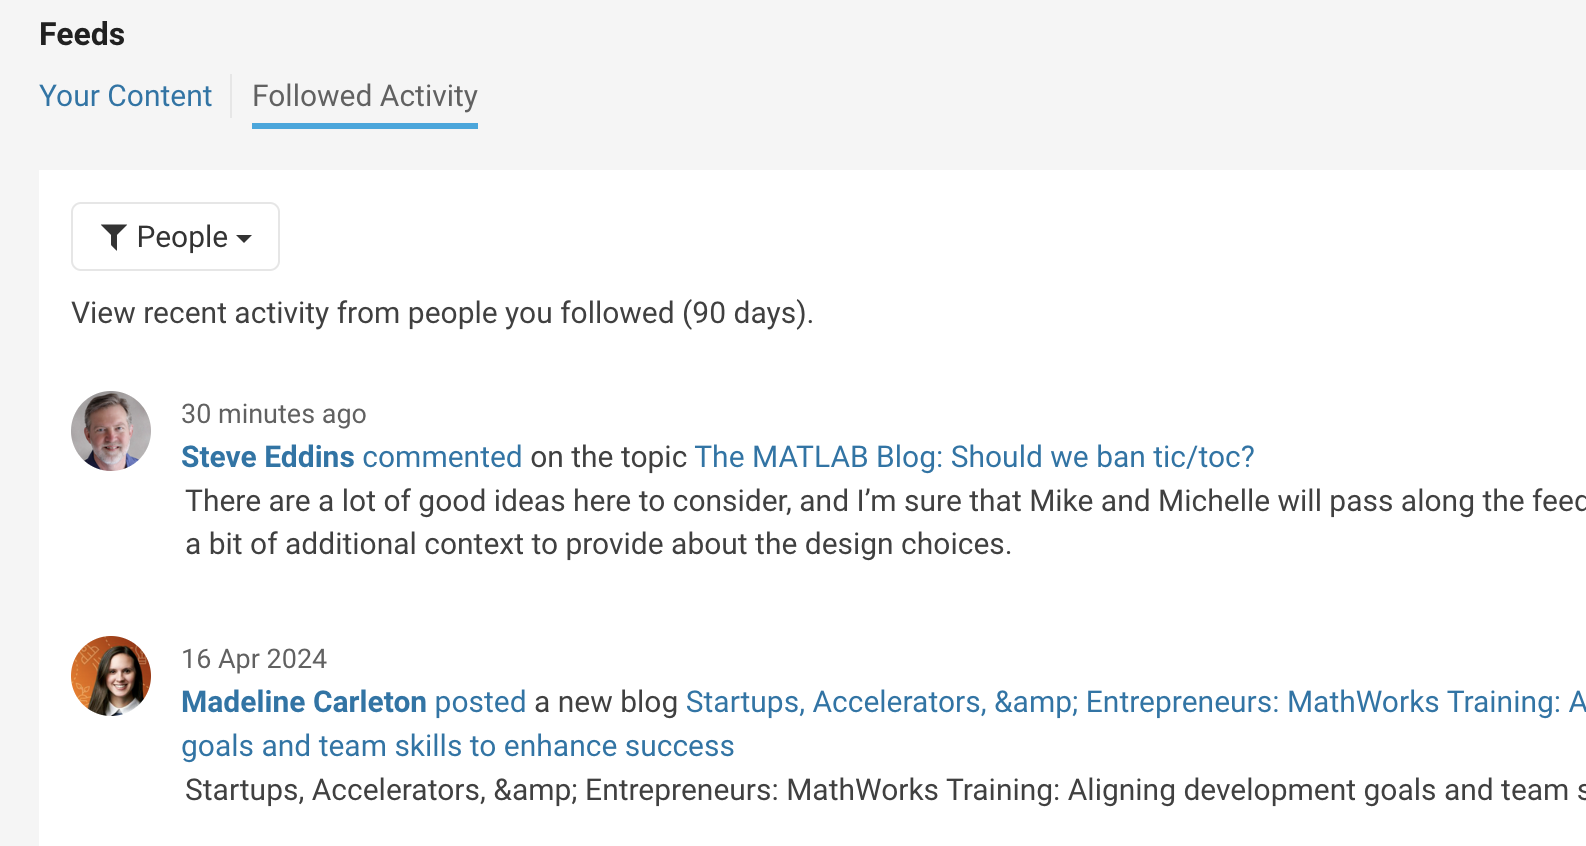
We strongly encourage you to take advantage of the User Following feature to foster learning and collaboration within our vibrant community.
Who will be the first person you choose to follow? Share your answer in the comments section below and let's inspire each other to explore new horizons together.
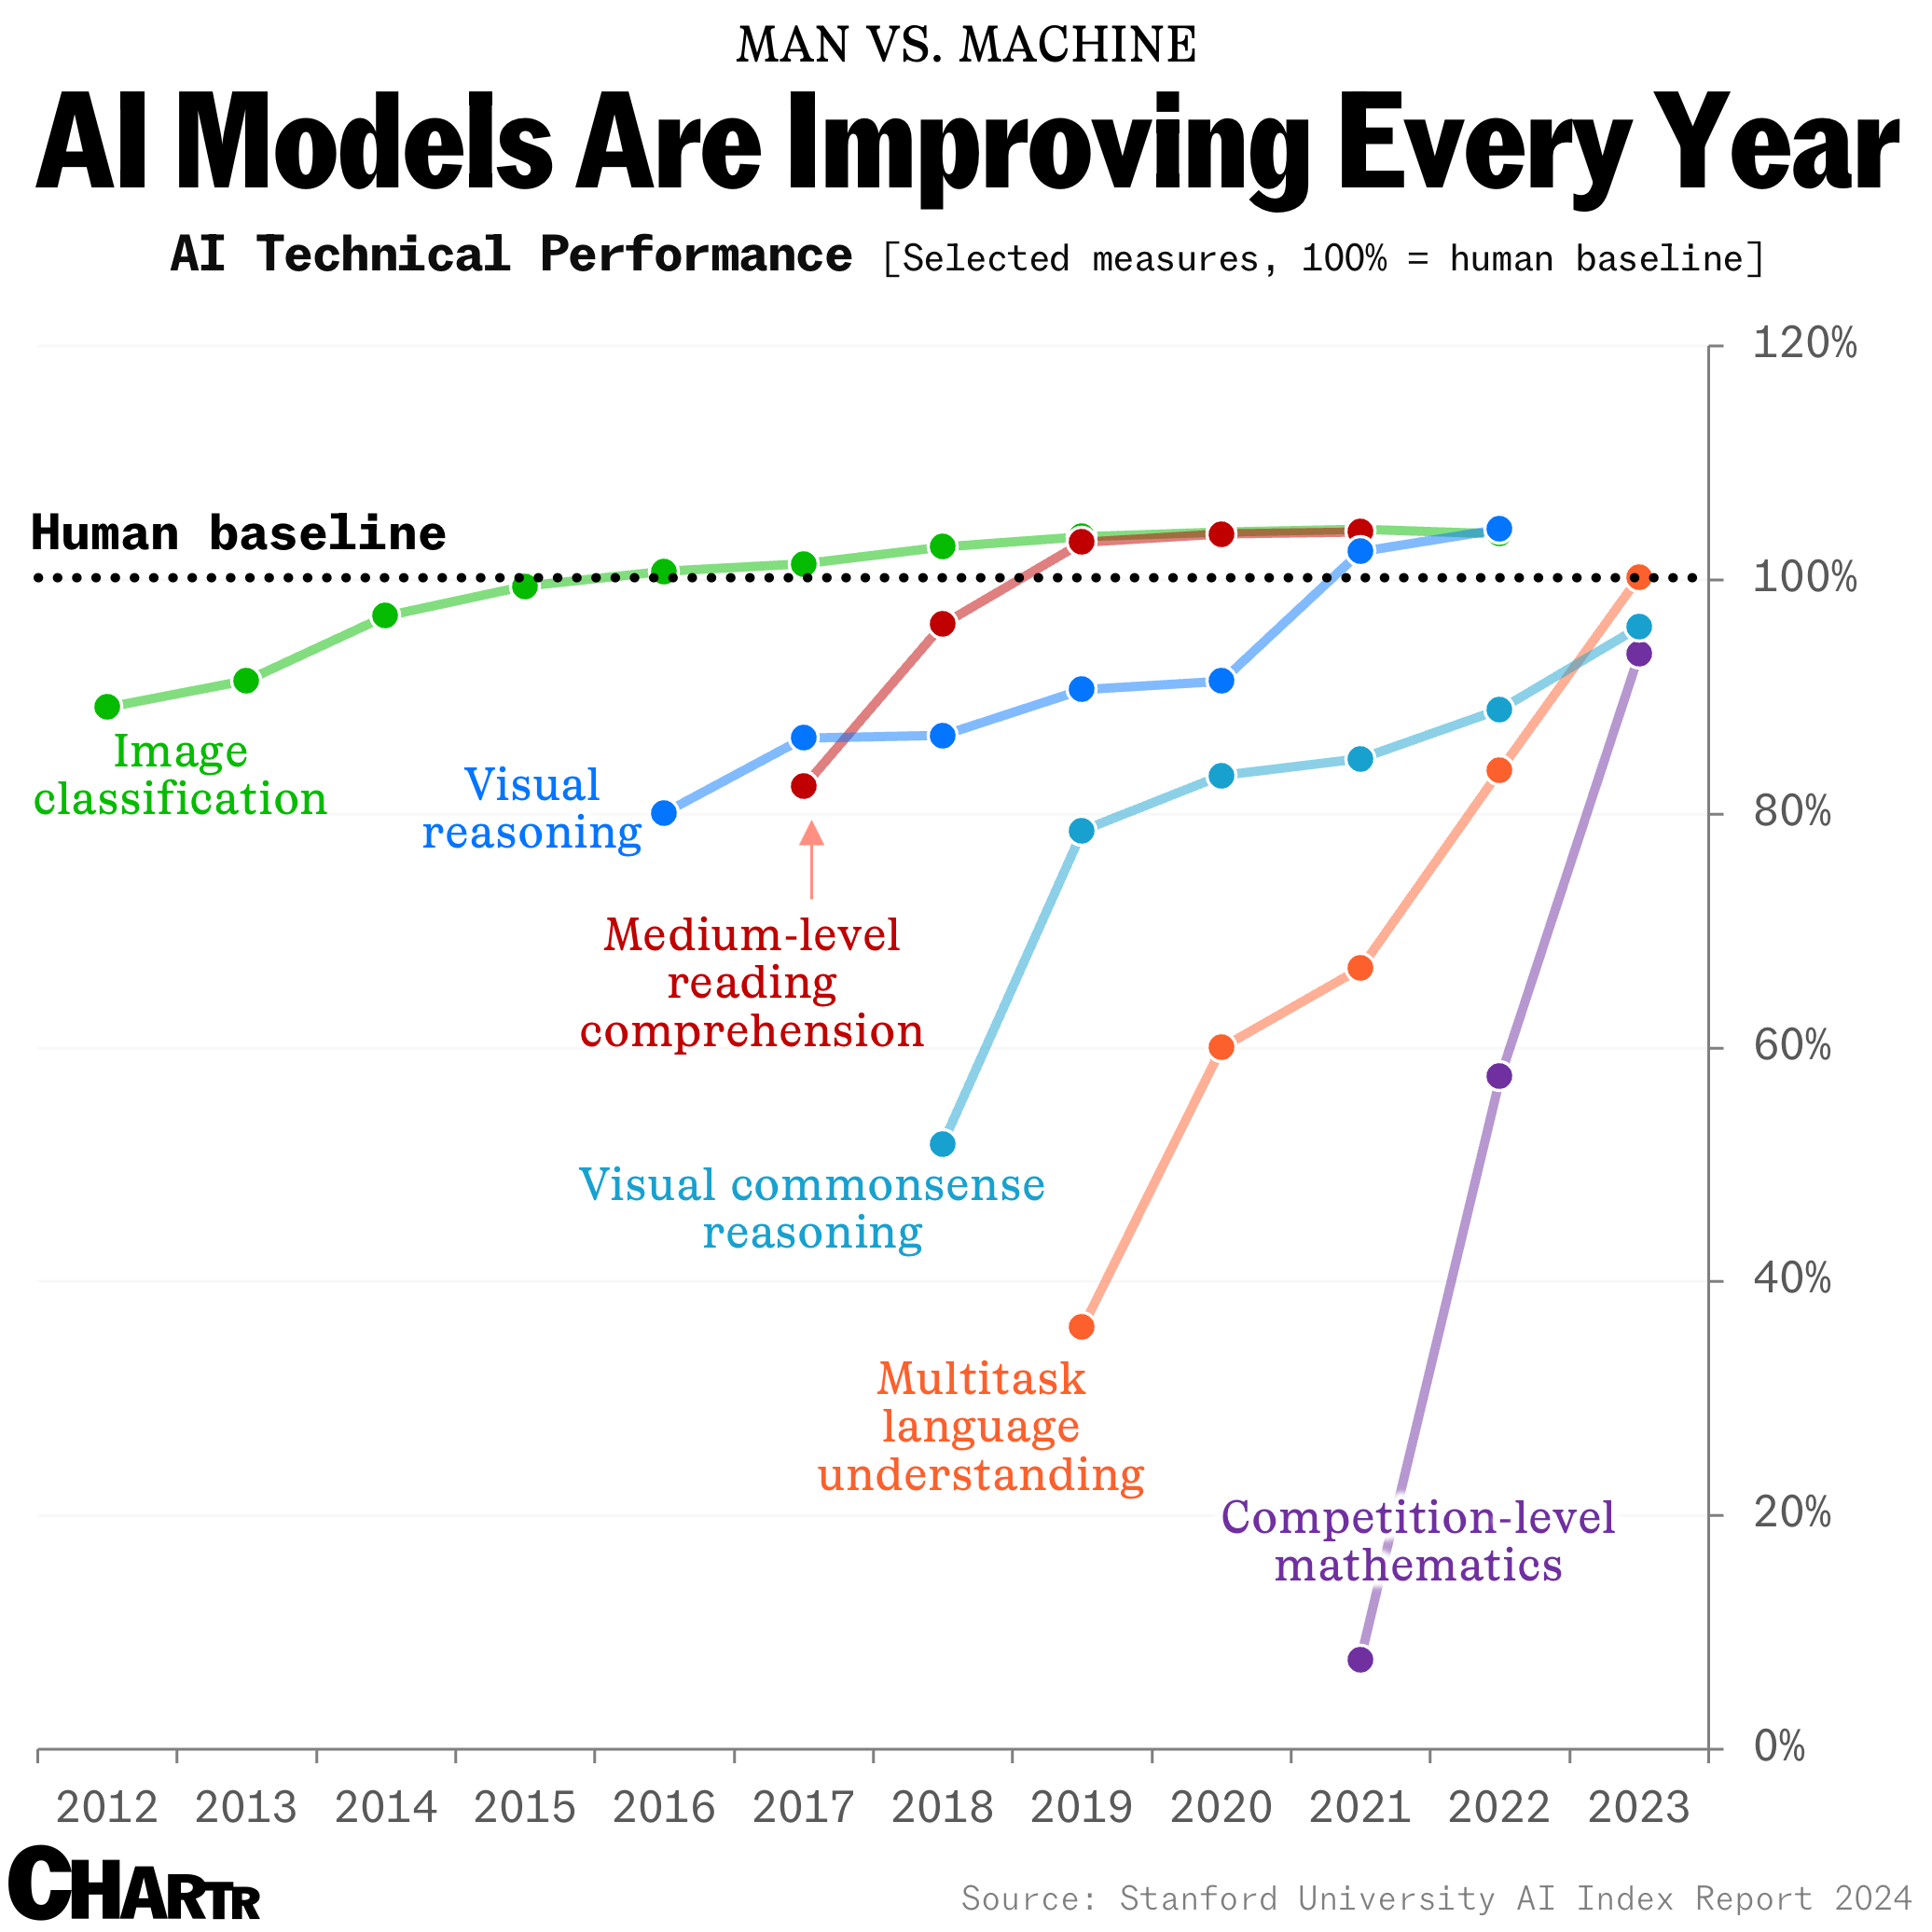
How long until the 'dumbest' models are smarter than your average person? Thanks for sharing this article @Adam Danz
ismissing( { [ ] } )
26%
ismissing( NaN )
18%
ismissing( NaT )
11%
ismissing( missing )
21%
ismissing( categorical(missing) )
9%
ismissing( { '' } ) % 2 apostrophes
16%
896 个投票
Hey MATLAB Community! 🌟
As we continue to explore, learn, and innovate together, it's essential to take a moment to recognize the remarkable contributions that have sparked engaging discussions, solved perplexing problems, and shared insightful knowledge in the past two weeks. Let's dive into the highlights that have made our community even more vibrant and resourceful.
Interesting Questions
Burhan Burak brings up an intriguing issue faced when running certain code in MATLAB, seeking advice on how to refactor the code to eliminate a warning message. It's a great example of the practical challenges we often encounter
Jenni asks for guidance on improving linear models to fit data points more accurately. This question highlights the common hurdles in data analysis and model fitting, sparking a conversation on best practices and methodologies.
Popular Discussions
A thought-provoking question posed by goc3 that delves into the intricacies of MATLAB's logical operations. It's a great discussion starter that tests and expands our understanding of MATLAB's behavior.
Toshiaki Takeuchi shares an insightful visualization of the demand for MATLAB jobs across different regions, based on data from LinkedIn. This post not only provides a snapshot of the job market but also encourages members to discuss trends in MATLAB's use in the industry.
From the Blogs
Mike Croucher shares his excitement and insights on two long-awaited features finally making their way into MATLAB R2024a. His post reflects the passion and persistence of our community members in enhancing MATLAB's functionality.
In this informative post, Sivylla Paraskevopoulou offers practical tips for speeding up the training of deep learning models. It's a must-read for anyone looking to optimize their deep learning workflows.
A Heartfelt Thank You 🙏
To everyone who asked a question, started a discussion, or wrote a blog post: Thank you! Your contributions are what make our community a fountain of knowledge, inspiration, and innovation. Let's keep the momentum going and continue to support each other in our journey to explore the vast universe of MATLAB.
Happy Coding!
Note: If you haven't yet, make sure to check out these highlights and add your voice to our growing community. Your insights and experiences are what make us stronger.
You reached this milestone by providing valuable contribution to the community since you started answering questions in Since September 2011.
You were very active in the first year, and took some break, but you steadily rose ranks in the recent years to achieve this milestone.
You provided 3954 answers and received 1503 votes. You are ranked #25 in the community. Thank you for your contribution to the community and please keep up the good track record!
MATLAB Central Team
In honor of National Pet Day on April 11th, we're excited to announce a fun contest that combines two of our favorite things: our beloved pets and our passion for MATLAB/Simulink! Whether you're a cat enthusiast, a dog lover, or a companion to any other pet, we invite you to join in the fun and showcase your creativity.
How to Participate:
- Take a photo of your pet featuring any element of MATLAB/Simulink.
- Post it in the Fun channel of the Discussions area.
- Include a brief description or story behind the photo - we love to hear about your pets and your creative process!
🏆 Prizes:
We will be selecting 3 winners for this contest, and each winner will receive a MathWorks T-shirt or hat! Winners will be chosen based on creativity, originality, and how well they incorporate the MATLAB/Simulink element into their photo.
📅Important Dates:
Contest ends on April 12th, 2024, at 11:59:59 pm, Eastern Time
We can't wait to see all of your adorable and creative pet photos. Let's celebrate National Pet Day in true MathWorks style. Good luck, and most importantly, have fun!

MatGPT was launched on March 22, 2023 and I am amazed at how many times it has been downloaded since then - close to 16,000 downloads in one year. When AI Chat Playground came out on MATLAB Central, I thought surely that people will stop using MatGPT. Boy I was wrong.
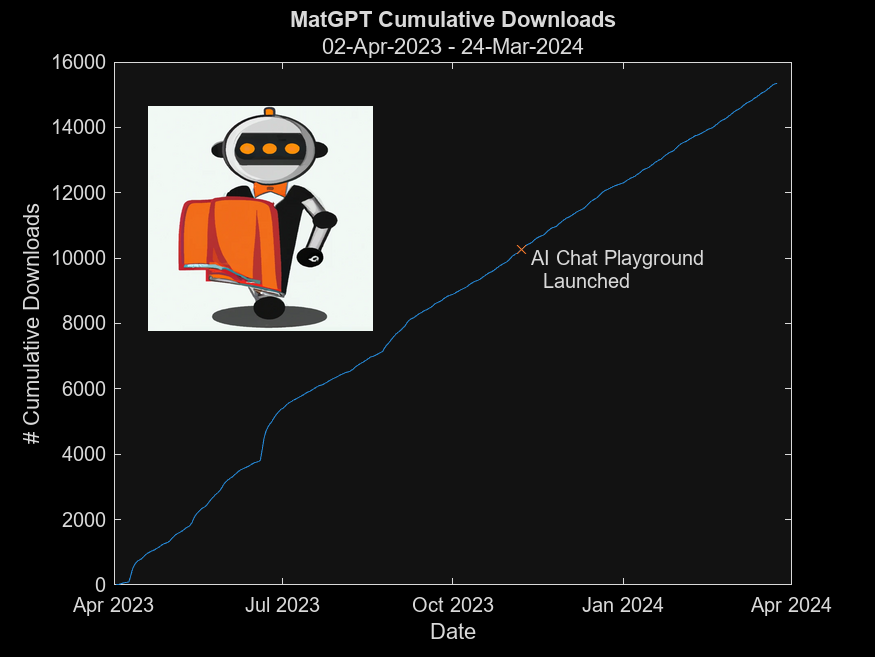
In early 2023 I was playing with the new shiny toy called ChatGPT like everyone else but instead of having it tell me jokes or haiku, I wanted to know how I can use it on MATLAB, and I started collecting the prompts that worked. Someone suggested I should turn that into an app, and MatGPT was born with help from other colleagues.
Here is the question - what should I do with it now? Some people suggested I could add other LLMs like Gemini or Claude, but I am more interested in learning how people actually use it.
If you are a MatGPT user, do you mind sharing how you use the app?
In short: support varying color in at least the plot, plot3, fplot, and fplot3 functions.
This has been a thing that's come up quite a few times, and includes questions/requests by users, workarounds by the community, and workarounds presented by MathWorks -- examples of each below. It's a feature that exists in Python's Matplotlib library and Sympy. Anyways, given that there are myriads of workarounds, it appears to be one of the most common requests for Matlab plots (Matlab's plotting is, IMO, one of the best features of the product), the request precedes the 21st century, and competitive tools provide the functionality, it would seem to me that this might be the next great feature for Matlab plotting.
I'm curious to get the rest of the community's thoughts... what's everyone else think about this?
---
User questions/requests
- https://www.mathworks.com/matlabcentral/answers/480389-colored-line-plot-according-to-a-third-variable
- https://www.mathworks.com/matlabcentral/answers/2092641-how-to-solve-a-problem-with-the-generation-of-multiple-colored-segments-on-one-line-in-matlab-plot
- https://www.mathworks.com/matlabcentral/answers/5042-how-do-i-vary-color-along-a-2d-line
- https://www.mathworks.com/matlabcentral/answers/1917650-how-to-plot-a-trajectory-with-varying-colour
- https://www.mathworks.com/matlabcentral/answers/1917650-how-to-plot-a-trajectory-with-varying-colour
- https://www.mathworks.com/matlabcentral/answers/511523-how-to-create-plot3-varying-color-figure
- https://www.mathworks.com/matlabcentral/answers/393810-multiple-colours-in-a-trajectory-plot
- https://www.mathworks.com/matlabcentral/answers/523135-creating-a-rainbow-colour-plot-trajectory
- https://www.mathworks.com/matlabcentral/answers/469929-how-to-vary-the-color-of-a-dynamic-line
- https://www.mathworks.com/matlabcentral/answers/585011-how-could-i-adjust-the-color-of-multiple-lines-within-a-graph-without-using-the-default-matlab-colo
- https://www.mathworks.com/matlabcentral/answers/517177-how-to-interpolate-color-along-a-curve-with-specific-colors
- https://www.mathworks.com/matlabcentral/answers/281645-variate-color-depending-on-the-y-value-in-plot
- https://www.mathworks.com/matlabcentral/answers/439176-how-do-i-vary-the-color-along-a-line-in-polar-coordinates
- https://www.mathworks.com/matlabcentral/answers/1849193-creating-rainbow-coloured-plots-in-3d
- https://groups.google.com/g/comp.soft-sys.matlab/c/cLgjSeEC15I?hl=en&pli=1 (a question asked in 1999!)
- ... the list goes on, and on, and on...
User-provided workarounds
- https://undocumentedmatlab.com/articles/plot-line-transparency-and-color-gradient
- https://www.mathworks.com/matlabcentral/fileexchange/19476-colored-line-or-scatter-plot
- https://www.mathworks.com/matlabcentral/fileexchange/23566-3d-colored-line-plot
- https://www.mathworks.com/matlabcentral/fileexchange/30423-conditionally-colored-line-plot
- https://www.mathworks.com/matlabcentral/fileexchange/14677-cline
- https://www.mathworks.com/matlabcentral/fileexchange/8597-plot-3d-color-line
- https://www.mathworks.com/matlabcentral/fileexchange/39972-colormapline-color-changing-2d-or-3d-line
- https://www.mathworks.com/matlabcentral/fileexchange/37725-conditionally-colored-plot-ccplot
- https://www.mathworks.com/matlabcentral/fileexchange/11611-linear-2d-plot-with-rainbow-color
- https://www.mathworks.com/matlabcentral/fileexchange/26692-color_line
- https://www.mathworks.com/matlabcentral/fileexchange/32911-plot3rgb
- And perhaps more?
MathWorks-provided workarounds
- https://www.mathworks.com/videos/coloring-a-line-based-on-height-gradient-or-some-other-value-in-matlab-97128.html
- https://www.mathworks.com/videos/making-a-multi-color-line-in-matlab-97127.html
- https://www.mathworks.com/matlabcentral/fileexchange/95663-color-trajectory-plot (contributed by a MathWorks staff member)
- And perhaps more?
isempty( [ ] )
10%
isempty( { } )
13%
isempty( '' ) % 2 single quotes
13%
isempty( "" ) % 2 double quotes
24%
c = categorical( [ ] ); isempty(c)
18%
s = struct("a", [ ] ); isempty(s.a)
22%
1324 个投票
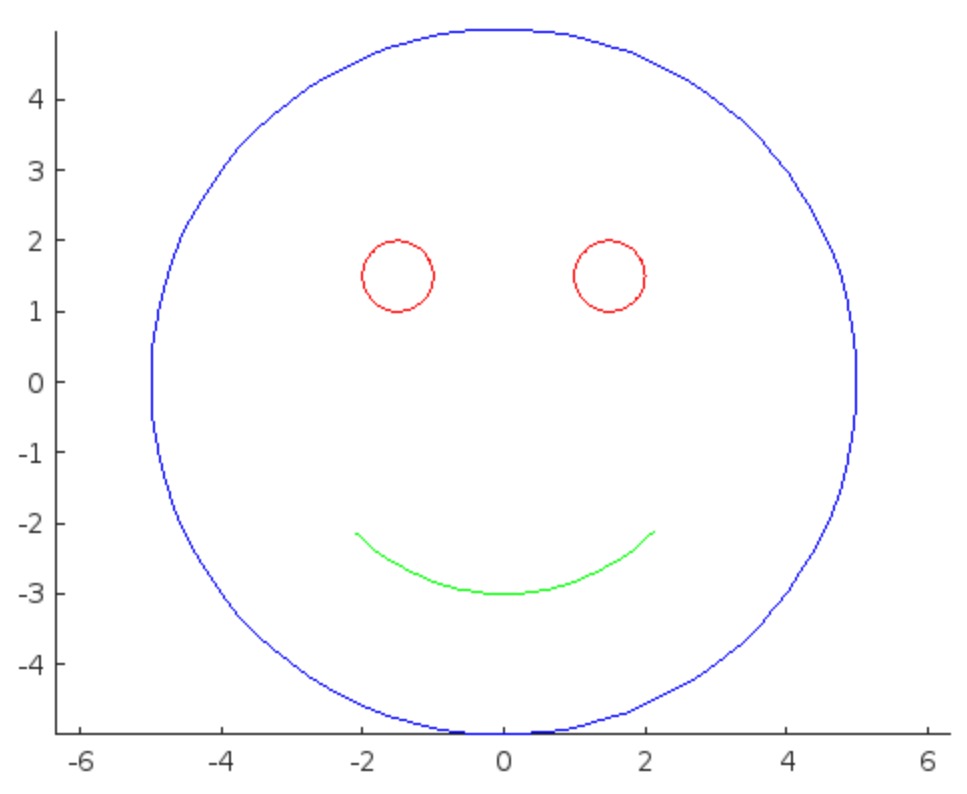
I was in a meeting the other day and a coworker shared a smiley face they created using the AI Chat Playground. The image looked something like this:

And I suspect the prompt they used was something like this:
"Create a smiley face"
I imagine this output wasn't what my coworker had expected so he was left thinking that this was as good as it gets without manually editing the code, and that the AI Chat Playground couldn't do any better.
I thought I could get a better result using the Playground so I tried a more detailed prompt using a multi-step technique like this:
"Follow these instructions:
- Create code that plots a circle
- Create two smaller circles as eyes within the first circle
- Create an arc that looks like a smile in the lower part of the first circle"
The output of this prompt was better in my opinion.
These queries/prompts are examples of 'zero-shot' prompts, the expectation being a good result with just one query. As opposed to a back-and-forth chat session working towards a desired outcome.
I wonder how many attempts everyone tries before they decide they can't anything more from the AI/LLM. There are times I'll send dozens of chat queries if I feel like I'm getting close to my goal, while other times I'll try just one or two. One thing I always find useful is seeing how others interact with AI models, which is what inspired me to share this.
Does anyone have examples of techniques that work well? I find multi-step instructions often produces good results.
Looking for 10 candidates for a closed beta on new MATLAB live script features.
Do you use live scripts regularly in MATLAB? Do you collaborate with others using live scripts?
MathWorks is looking for 10 candidates for a closed beta on new features for live scripts. Help us develop exciting new features with your feedback.
If you are selected, you will receive an email invitation to sign an NDA
I will post here when the quota is filled

The image was created with DALL-E 3.
Hello, brilliant minds of our engineering community!
We hope this message finds you in the midst of an exciting project or, perhaps, deep in the realms of a challenging problem, because we've got some groundbreaking news that might just make your day a whole lot more interesting.

🎉 Introducing PreAnswer AI - The Future of Community Support! 🎉
Have you ever found yourself pondering over a complex problem, wishing for an answer to magically appear before you even finish formulating the question? Well, wish no more! The MathWorks team, in collaboration with the most imaginative minds from the realms of science fiction, is thrilled to announce the launch of PreAnswer AI, an unprecedented feature set to revolutionize the way we interact within our MATLAB and Simulink community.
What is PreAnswer AI?
PreAnswer AI is our latest AI-driven initiative designed to answer your questions before you even ask them. Yes, you read that right! Through a combination of predictive analytics, machine learning, and a pinch of engineering wizardry, PreAnswer AI anticipates the challenges you're facing and provides you with solutions, insights, and code snippets in real-time.
How Does It Work?
- Presentiment Algorithms: By simply logging into MATLAB Central, our AI begins to analyze your recent coding patterns, activity, and even the intensity of your keyboard strokes to understand your current state of mind.
- Predictive Insights: Using a complex algorithm, affectionately dubbed "The Oracle", PreAnswer AI predicts the questions you're likely to ask and compiles comprehensive answers from our vast database of resources.
- Efficiency and Speed: Imagine the time saved when the answers to your questions are already waiting for you. PreAnswer AI ensures you spend more time innovating and less time searching for solutions.
We are on the cusp of deploying PreAnswer AI in a beta phase and are eager for you to be among the first to experience its benefits. Your feedback will be invaluable as we refine this feature to better suit our community's needs.
---------------------------------------------------------------
Spoiler, it's April 1st if you hadn't noticed. While we might not (yet) have the technology to read minds or predict the future, we do have an incredible community filled with knowledgeable, supportive members ready to tackle any question you throw their way.
Let's continue to collaborate, innovate, and solve complex problems together, proving that while AI can do many things, the power of a united community of brilliant minds is truly unmatched.
Thank you for being such a fantastic part of our community. Here's to many more questions, answers, and shared laughs along the way.
Happy April Fools' Day!
More than 500,000 people have subscribed to the MATLAB channel. MathWorks would like to thank everyone who has taken the time to watch one of our videos, leave us a comment, or share our videos with others. Together we’re accelerating the pace of engineering and science.
I would like to propose the creation of MATLAB EduHub, a dedicated channel within the MathWorks community where educators, students, and professionals can share and access a wealth of educational material that utilizes MATLAB. This platform would act as a central repository for articles, teaching notes, and interactive learning modules that integrate MATLAB into the teaching and learning of various scientific fields.
Key Features:
1. Resource Sharing: Users will be able to upload and share their own educational materials, such as articles, tutorials, code snippets, and datasets.
2. Categorization and Search: Materials can be categorized for easy searching by subject area, difficulty level, and MATLAB version..
3. Community Engagement: Features for comments, ratings, and discussions to encourage community interaction.
4. Support for Educators: Special sections for educators to share teaching materials and track engagement.
Benefits:
- Enhanced Educational Experience: The platform will enrich the learning experience through access to quality materials.
- Collaboration and Networking: It will promote collaboration and networking within the MATLAB community.
- Accessibility of Resources: It will make educational materials available to a wider audience.
By establishing MATLAB EduHub, I propose a space where knowledge and experience can be freely shared, enhancing the educational process and the MATLAB community as a whole.
Hey MATLAB Community! 🌟
March has been bustling with activity on MATLAB Central, bringing forth a treasure trove of insights, innovations, and fun. Whether you're delving into the intricacies of spline conversions or seeking inspiration from Pi Day celebrations, there's something for everyone.
Here’s a roundup of the top posts from the past few weeks that you won't want to miss:
Interesting questions
Dive into the technicalities of converting spline forms with a focus on calculating coefficients. A must-read for anyone dealing with spline representations.
Explore the challenges and solutions in tuning autopilot gains within a non-linear model of a business jet aircraft.
Popular discussions
Celebrate Pi Day with cool MATLAB implementations and code. A delightful read filled with π-inspired creativity.
Get a glimpse of fun with MATLAB through an engaging visual shared by Athanasios. A light-hearted thread that showcases the fun side of mathematics.
From File Exchange
Unlock the secrets of global climate data with MATLAB. This thread offers tools and insights for analyzing precipitation variability.
Interact with a numerical puddle in real-time and explore the dynamics of disturbances. A fascinating exploration of fluid dynamics simulation.
From the Blogs
Revisit Pi Day with Jiro's picks of the coolest π visualizations. A post that combines art, math, and the joy of exploration.
Discover the synergy between MATLAB and Visual Studio Code, enhanced by GitHub Copilot support. A game-changer for MATLAB developers.
These threads are just the tip of the iceberg. Each post is a gateway to new knowledge, ideas, and community connections. Dive in, explore, and don't forget to contribute your insights and questions. Together, we make MATLAB Central a vibrant hub of innovation and support.
Happy Coding!
您也可以从以下列表中选择网站:
美洲
- América Latina (Español)
- Canada (English)
- United States (English)
欧洲
- Belgium (English)
- Denmark (English)
- Deutschland (Deutsch)
- España (Español)
- Finland (English)
- France (Français)
- Ireland (English)
- Italia (Italiano)
- Luxembourg (English)
- Netherlands (English)
- Norway (English)
- Österreich (Deutsch)
- Portugal (English)
- Sweden (English)
- Switzerland
- United Kingdom(English)
亚太
- Australia (English)
- India (English)
- New Zealand (English)
- 中国
- 日本Japanese (日本語)
- 한국Korean (한국어)