Results for
- It's free.
- It's online.
- Registration is now open.
- AI in Engineering
- Modeling and Simulation
- Implementation and DevOps
- Algorithm Development and Deployment
- 5G, Wireless, and Radar
- Autonomous Systems and Robotics
- Electrification, Motor Control, and Power Systems
- Preparing Future Engineers
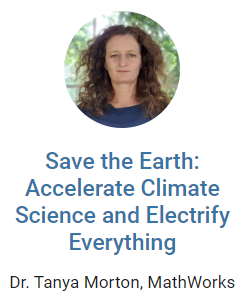
Climate Data Toolbox was developed by Chad Greene, a postdoctoral research fellow at NASA Jet Propulsion Laboratory, and Kelly Kearney, a research scientist at University of Washington. The Climate Data Toolbox is freely downloadable from File Exchange and has been downloaded over 5,000 times since 2019.
The toolbox was inspired by one big idea: There are a common set of tasks related to data processing, analysis and visualization that Geoscience researchers and students working with climate data typically perform. Greene and coauthors make the case in their paper published in Geochemistry, Geophysics, Geosystems that having everyone who is tackling climate analysis separately recoding these same tasks is not a good use of time, for the individual or the collective, as it takes away from other more innovative climate work. Better to have a set of reusable, publicly shared functions for those repetitive tasks.
Recently, Lisa Kempler published an example of how to look at the change in temperature of the Pacific Ocean over time using MATLAB and the Climate Data Toolbox.
Try the example here by loading up MATLAB, installing the Climate Data Toolbox, and following along the tutorial.
MATLAB EXPO 2021 is May 4-5, 2021!
MATLAB EXPO is open to everyone:
- It's free.
- It's online.
- Register now. [Edit: Registration is closed]
Industry Tracks:
- AI in Engineering
- Modeling and Simulation
- Implementation, Verification, and DevOps
- Algorithm Development and Deployment
- 5G and Radar
- FPGA, ASIC, and SoC Design
- Autonomous Systems
- Teaching with MATLAB and Simulink
- Cloud and IoT
- Motor and Power Control
Special Event: Women in Tech Ignite Session
Women in Tech Ignite is a networking event where the MATLAB community can meet and be inspired by a diverse group of women engineers and scientists and hear about the innovative ways they use MathWorks products. Attendees of all genders are welcome.
[Edit: Registration is closed]
您也可以从以下列表中选择网站:
美洲
- América Latina (Español)
- Canada (English)
- United States (English)
欧洲
- Belgium (English)
- Denmark (English)
- Deutschland (Deutsch)
- España (Español)
- Finland (English)
- France (Français)
- Ireland (English)
- Italia (Italiano)
- Luxembourg (English)
- Netherlands (English)
- Norway (English)
- Österreich (Deutsch)
- Portugal (English)
- Sweden (English)
- Switzerland
- United Kingdom(English)
亚太
- Australia (English)
- India (English)
- New Zealand (English)
- 中国
- 日本Japanese (日本語)
- 한국Korean (한국어)