主要内容
Results for
Hello MATLAB Community!
We've had an exciting few weeks filled with insightful discussions, innovative tools, and engaging blog posts from our vibrant community. Here's a highlight of some noteworthy contributions that have sparked interest and inspired us all. Let's dive in!
Interesting Questions
Cindyawati explores the intriguing concept of interrupting continuous data in differential equations to study the effects of drug interventions in disease models. A thought-provoking question that bridges mathematics and medical research.
Pedro delves into the application of Linear Quadratic Regulator (LQR) for error dynamics and setpoint tracking, offering insights into control systems and their real-world implications.
Popular Discussions
Chen Lin shares an engaging interview with Zhaoxu Liu, shedding light on the creative processes behind some of the most innovative MATLAB contest entries of 2023. A must-read for anyone looking for inspiration!
Zhaoxu Liu, also known as slanderer, updates the community with the latest version of the MATLAB Plot Cheat Sheet. This resource is invaluable for anyone looking to enhance their data visualization skills.
From File Exchange
Giorgio introduces a toolbox for frequency estimation, making it simpler for users to import signals directly from the MATLAB workspace. A significant contribution for signal processing enthusiasts.
From the Blogs
Cleve Moler revisits a classic program for predicting future trends based on census data, offering a fascinating glimpse into the evolution of computational forecasting.
Boost Your App Design Efficiency – Effortless Component Swapping & Labeling in App Designer by Adam Danz
With contributions from Dinesh Kavalakuntla, Adam presents an insightful guide on improving app design workflows in MATLAB App Designer, focusing on component swapping and labeling.
We're incredibly proud of the diverse and innovative contributions our community members make every day. Each post, discussion, and tool not only enriches our knowledge but also inspires others to explore and create. Let's continue to support and learn from each other as we advance in our MATLAB journey.
Happy Coding!
quick / easy
21%
themed / in a group
21%
challenge (e.g., banned functions)
14%
puzzle / game
15%
educational
27%
other (comment below)
3%
111 个投票
Drumlin Farm has welcomed MATLAMB, named in honor of MathWorks, among ten adorable new lambs this season!

I found this plot of words said by different characters on the US version of The Office sitcom. There's a sparkline for each character from pilot to finale episode.
RGB triplet [0,1]
9%
RGB triplet [0,255]
12%
Hexadecimal Color Code
13%
Indexed color
16%
Truecolor array
37%
Equally unfamiliar with all-above
13%
2694 个投票
A high school student called for help with this physics problem:

- Car A moves with constant velocity v.
- Car B starts to move when Car A passes through the point P.
- Car B undergoes...
- uniform acc. motion from P to Q.
- uniform velocity motion from Q to R.
- uniform acc. motion from R to S.
- Car A and B pass through the point R simultaneously.
- Car A and B arrive at the point S simultaneously.
Q1. When car A passes the point Q, which is moving faster?
Q2. Solve the time duration for car B to move from P to Q using L and v.
Q3. Magnitude of acc. of car B from P to Q, and from R to S: which is bigger?
Well, it can be solved with a series of tedious equations. But... how about this?

Code below:
%% get images and prepare stuffs
figure(WindowStyle="docked"),
ax1 = subplot(2,1,1);
hold on, box on
ax1.XTick = [];
ax1.YTick = [];
A = plot(0, 1, 'ro', MarkerSize=10, MarkerFaceColor='r');
B = plot(0, 0, 'bo', MarkerSize=10, MarkerFaceColor='b');
[carA, ~, alphaA] = imread('https://cdn.pixabay.com/photo/2013/07/12/11/58/car-145008_960_720.png');
[carB, ~, alphaB] = imread('https://cdn.pixabay.com/photo/2014/04/03/10/54/car-311712_960_720.png');
carA = imrotate(imresize(carA, 0.1), -90);
carB = imrotate(imresize(carB, 0.1), 180);
alphaA = imrotate(imresize(alphaA, 0.1), -90);
alphaB = imrotate(imresize(alphaB, 0.1), 180);
carA = imagesc(carA, AlphaData=alphaA, XData=[-0.1, 0.1], YData=[0.9, 1.1]);
carB = imagesc(carB, AlphaData=alphaB, XData=[-0.1, 0.1], YData=[-0.1, 0.1]);
txtA = text(0, 0.85, 'A', FontSize=12);
txtB = text(0, 0.17, 'B', FontSize=12);
yline(1, 'r--')
yline(0, 'b--')
xline(1, 'k--')
xline(2, 'k--')
text(1, -0.2, 'Q', FontSize=20, HorizontalAlignment='center')
text(2, -0.2, 'R', FontSize=20, HorizontalAlignment='center')
% legend('A', 'B') % this make the animation slow. why?
xlim([0, 3])
ylim([-.3, 1.3])
%% axes2: plots velocity graph
ax2 = subplot(2,1,2);
box on, hold on
xlabel('t'), ylabel('v')
vA = plot(0, 1, 'r.-');
vB = plot(0, 0, 'b.-');
xline(1, 'k--')
xline(2, 'k--')
xlim([0, 3])
ylim([-.3, 1.8])
p1 = patch([0, 0, 0, 0], [0, 1, 1, 0], [248, 209, 188]/255, ...
EdgeColor = 'none', ...
FaceAlpha = 0.3);
%% solution
v = 1; % car A moves with constant speed.
L = 1; % distances of P-Q, Q-R, R-S
% acc. of car B for three intervals
a(1) = 9*v^2/8/L;
a(2) = 0;
a(3) = -1;
t_BatQ = sqrt(2*L/a(1)); % time when car B arrives at Q
v_B2 = a(1) * t_BatQ; % speed of car B between Q-R
%% patches for velocity graph
p2 = patch([t_BatQ, t_BatQ, t_BatQ, t_BatQ], [1, 1, v_B2, v_B2], ...
[248, 209, 188]/255, ...
EdgeColor = 'none', ...
FaceAlpha = 0.3);
p3 = patch([2, 2, 2, 2], [1, v_B2, v_B2, 1], [194, 234, 179]/255, ...
EdgeColor = 'none', ...
FaceAlpha = 0.3);
%% animation
tt = linspace(0, 3, 2000);
for t = tt
A.XData = v * t;
vA.XData = [vA.XData, t];
vA.YData = [vA.YData, 1];
if t < t_BatQ
B.XData = 1/2 * a(1) * t^2;
vB.XData = [vB.XData, t];
vB.YData = [vB.YData, a(1) * t];
p1.XData = [0, t, t, 0];
p1.YData = [0, vB.YData(end), 1, 1];
elseif t >= t_BatQ && t < 2
B.XData = L + (t - t_BatQ) * v_B2;
vB.XData = [vB.XData, t];
vB.YData = [vB.YData, v_B2];
p2.XData = [t_BatQ, t, t, t_BatQ];
p2.YData = [1, 1, vB.YData(end), vB.YData(end)];
else
B.XData = 2*L + v_B2 * (t - 2) + 1/2 * a(3) * (t-2)^2;
vB.XData = [vB.XData, t];
vB.YData = [vB.YData, v_B2 + a(3) * (t - 2)];
p3.XData = [2, t, t, 2];
p3.YData = [1, 1, vB.YData(end), v_B2];
end
txtA.Position(1) = A.XData(end);
txtB.Position(1) = B.XData(end);
carA.XData = A.XData(end) + [-.1, .1];
carB.XData = B.XData(end) + [-.1, .1];
drawnow
end
is there any sites available online free ai course learning except: coursera.org
Northern lights captured from this weekend at MathWorks campus ✨
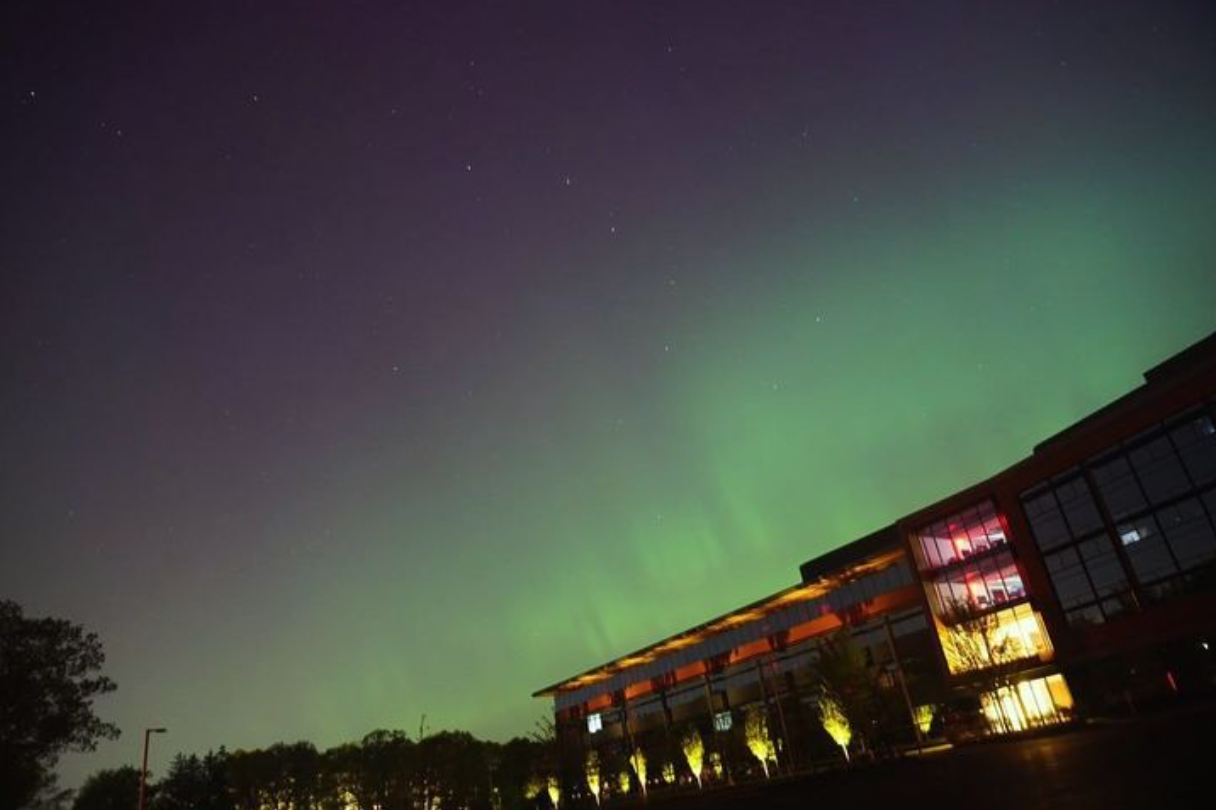
Did you get a chance to see lights and take some photos?
isstring
11%
ischar
7%
iscellstr
13%
isletter
21%
isspace
9%
ispunctuation
37%
2455 个投票
Dear MATLAB contest enthusiasts,
I believe many of you have been captivated by the innovative entries from Zhaoxu Liu / slanderer, in the 2023 MATLAB Flipbook Mini Hack contest.


Ever wondered about the person behind these creative entries? What drives a MATLAB user to such levels of skill? And what inspired his participation in the contest? We were just as curious as you are!
We were delighted to catch up with him and learn more about his use of MATLAB. The interview has recently been published in MathWorks Blogs. For an in-depth look into his insights and experiences, be sure to read our latest blog post: Community Q&A – Zhaoxu Liu.
But the conversation doesn't end here! Who would you like to see featured in our next interview? Drop their name in the comments section below and let us know who we should reach out to next!
Hey MATLAB Community! 🌟
In the vibrant landscape of our online community, the past few weeks have been particularly exciting. We've seen a plethora of contributions that not only enrich our collective knowledge but also foster a spirit of collaboration and innovation. Here are some of the noteworthy contributions from our members.
Interesting Questions
Victor encountered a puzzling error while trying to publish his script to PDF. His post sparked a helpful discussion on troubleshooting this issue, proving invaluable for anyone facing similar challenges.
Devendra's inquiry into interpolating and smoothing NDVI time series using MATLAB has opened up a dialogue on various techniques to manage noisy data, benefiting researchers and enthusiasts in the field of remote sensing.
Popular Discussions
Adam Danz's AMA session has been a treasure trove of insights into the workings behind the MATLAB Answers forum, offering a unique perspective from a staff contributor's viewpoint.
The User Following feature marks a significant enhancement in how community members can stay connected with the contributions of their peers, fostering a more interconnected MATLAB Central.
From File Exchange
Robert Haaring's submission is a standout contribution, providing a sophisticated model for CO2 electrolysis, a topic of great relevance to researchers in environmental technology and chemical engineering.
From the Blogs
Verification and Validation for AI: From model implementation to requirements validation by Sivylla Paraskevopoulou
Sivylla's comprehensive post delves into the critical stages of AI model development, from implementation to validation, offering invaluable guidance for professionals navigating the complexities of AI verification.
In this engaging Q&A, Ned Gulley introduces us to Zhaoxu Liu, a remarkable community member whose innovative contributions and active engagement have left a significant impact on the MATLAB community.
Each of these contributions highlights the diverse and rich expertise within our community. From solving complex technical issues to introducing new features and sharing in-depth knowledge on specialized topics, our members continue to make MATLAB Central a vibrant and invaluable resource.
Let's continue to support, inspire, and learn from one another
Don't use / What are Projects?
26%
1–10
31%
11–20
15%
21–30
9%
31–50
7%
51+ (comment below)
12%
3940 个投票
Updating some of my educational Livescripts to 2024a, really love the new "define a function anywhere" feature, and have a "new" idea for improving Livescripts -- support "hidden" code blocks similar to the Jupyter Notebooks functionality.
For example, I often create "complicated" plots with a bunch of ancillary items and I don't want this code exposed to the reader by default, as it might confuse the reader. For example, consider a Livescript that might read like this:
-----
Noting the similar structure of these two mappings, let's now write a function that simply maps from some domain to some other domain using change of variable.
function x = ChangeOfVariable( x, from_domain, to_domain )
x = x - from_domain(1);
x = x * ( ( to_domain(2) - to_domain(1) ) / ( from_domain(2) - from_domain(1) ) );
x = x + to_domain(1);
end
Let's see this function in action
% HIDE CELL
clear
close all
from_domain = [-1, 1];
to_domain = [2, 7];
from_values = [-1, -0.5, 0, 0.5, 1];
to_values = ChangeOfVariable( from_values, from_domain, to_domain )
to_values = 1×5
2.0000 3.2500 4.5000 5.7500 7.0000
We can plot the values of from_values and to_values, showing how they're connected to each other:
% HIDE CELL
figure
hold on
for n = 1 : 5
plot( [from_values(n) to_values(n)], [1 0], Color="k", LineWidth=1 )
end
ax = gca;
ax.YTick = [];
ax.XLim = [ min( [from_domain, to_domain] ) - 1, max( [from_domain, to_domain] ) + 1 ];
ax.YLim = [-0.5, 1.5];
ax.XGrid = "on";
scatter( from_values, ones( 5, 1 ), Marker="s", MarkerFaceColor="flat", MarkerEdgeColor="k", SizeData=120, LineWidth=1, SeriesIndex=1 )
text( mean( from_domain ), 1.25, "$\xi$", Interpreter="latex", HorizontalAlignment="center", VerticalAlignment="middle" )
scatter( to_values, zeros( 5, 1 ), Marker="o", MarkerFaceColor="flat", MarkerEdgeColor="k", SizeData=120, LineWidth=1, SeriesIndex=2 )
text( mean( to_domain ), -0.25, "$x$", Interpreter="latex", HorizontalAlignment="center", VerticalAlignment="middle" )
scaled_arrow( ax, [mean( [from_domain(1), to_domain(1) ] ) - 1, 0.5], ( 1 - 0 ) / ( from_domain(1) - to_domain(1) ), 1 )
scaled_arrow( ax, [mean( [from_domain(end), to_domain(end)] ) + 1, 0.5], ( 1 - 0 ) / ( from_domain(end) - to_domain(end) ), -1 )
text( mean( [from_domain(1), to_domain(1) ] ) - 1.5, 0.5, "$x(\xi)$", Interpreter="latex", HorizontalAlignment="center", VerticalAlignment="middle" )
text( mean( [from_domain(end), to_domain(end)] ) + 1.5, 0.5, "$\xi(x)$", Interpreter="latex", HorizontalAlignment="center", VerticalAlignment="middle" )

-----
Where scaled_arrow is some utility function I've defined elsewhere... See how a majority of the code is simply "drivel" to create the plot, clear and close? I'd like to be able to hide those cells so that it would look more like this:
-----
Noting the similar structure of these two mappings, let's now write a function that simply maps from some domain to some other domain using change of variable.
function x = ChangeOfVariable( x, from_domain, to_domain )
x = x - from_domain(1);
x = x * ( ( to_domain(2) - to_domain(1) ) / ( from_domain(2) - from_domain(1) ) );
x = x + to_domain(1);
end
Let's see this function in action
▶ Show code cell
from_domain = [-1, 1];
to_domain = [2, 7];
from_values = [-1, -0.5, 0, 0.5, 1];
to_values = ChangeOfVariable( from_values, from_domain, to_domain )
to_values = 1×5
2.0000 3.2500 4.5000 5.7500 7.0000
We can plot the values of from_values and to_values, showing how they're connected to each other:
▶ Show code cell

-----
Thoughts?
I recently had issues with code folding seeming to disappear and it turns out that I had unknowingly disabled the "show code folding margin" option by accident. Despite using MATLAB for several years, I had no idea this was an option, especially since there seemed to be no references to it in the code folding part of the "Preferences" menu.
It would be great if in the future, there was a warning that told you about this when you try enable/disable folding in the Preferences.
I am using 2023b by the way.
In the MATLAB editor, when clicking on a variable name, all the other instances of the variable name will be highlighted.
But this does not work for structure fields, which is a pity. Such feature would be quite often useful for me.
I show an illustration below, and compare it with Visual Studio Code that does it. ;-)
I am using MATLAB R2023a, sorry if it has been added to newer versions, but I didn't see it in the release notes.

Dear members, I’m currently doing research on the subject of using Generative A.I. as a digital designer. What our research group would like to know is which ethical issues have a big impact on the decisions you guys and girls make using generative A.I.
Whether you’re using A.I. or not, we would really like to know your vision and opinion about this subject. Please empty your thoughts and oppinion into your answers, we would like to get as much information as possible.
Are you currently using A.I. when doing your job? Yes, what for. No (not yet), why not?
Using A.I., would you use real information or alter names/numbers to get an answer?
What information would or wouldn’t you use? If the client is asking/ordering you to do certain things that go against your principles, would you still do it because order is order? How far would you go?
Who is responsible for the outcome of the generated content, you or the client?
Would you still feel like a product owner if it was co-developed with A.I.?
What we are looking for is that we would like to know why people do or don’t use AI in the field of design and wich ethical considerations they make. We’re just looking for general moral line of people, for example: 70% of designers don’t feel owner of a design that is generated by AI but 95% feels owner when it is co-created.
So therefore the questions we asked, we want to know the how you feel about this.

Welcome to MATLAB Central's first Ask Me Anything (AMA) session! Over the next few weeks, I look forward to addressing any questions or curiosities you might have about MATLAB, the forum, sasquatches, or whatever's on your mind. Having volunteered as a contributor to this community before joining MathWorks, I'm excited to act as a bridge between these two worlds. Let's kick things off by sharing a little-known fact about the forum’s staff contributors!
A couple of years ago, before I joined MathWorks as a developer on the Graphics and Charting team, I often wondered who were the MathWorkers with the [staff] moniker answering questions in the Answers forum. Is their MATLAB Central activity part of their day-to-day job expectations? Do they serve specific roles on some kind of community outreach team? Is their work in the forum voluntary in the same way that non-staff contributors volunteer their time?
Now that I'm on the inside, I'd like to share a secret with my fellow MATLAB users and MATLAB Central enthusiasts: with the exception of the MathWorks Support Team, staff participation in the Answers forum is completely voluntary! The staff contributions you see in the forum arise from pure intrinsic motivation to connect with users, help people out of ruts, and spread the word about our product!
For example, Steven Lord has contributed 20-150 answers per month for 9 years! Steven is a quality engineer for core MATLAB numerical functions. Cris LaPierre develops training material and has been a faithful contributor in the forum for almost 6 years! Kojiro Saito and Akira Agata have been tackling Japanese content for more than 7 years! There are many others who have inspired me as a user, and I am honored to now call colleagues: Peter Perkins, Michio, Joss Knight, Alan Weiss, Jiro Doke, Edric Ellis, and many others who deserve appreciation.
The forum's success hinges on the invaluable contributions from the majority of non-staff volunteers, whose dedication and expertise fuel our community. But I know I wasn't alone in wondering about these staff contributors, so now you're in on the secret!
I'm curious to know what other topics you're interested in learning about. Ask me anything!
numel(v)
6%
length(v)
13%
width(v)
14%
nnz(v)
8%
size(v, 1)
27%
sum(v > 0)
31%
2537 个投票
We're thrilled to unveil a new feature in the MATLAB Central community: User Following.
Our community is so lucky to have many experienced MATLAB experts who generously share their knowledge and insights across different applications, including Answers, File Exchange, Discussions, Contests, or Blogs.
With the introduction of User Following feature, you can now easily track new content across different areas and engage in discussions with people you follow. Simply click the ‘Follow’ button located on their profile page to start.
Depending on your communication setting, you will receive notifications via email and/or view updates in your ‘Followed Activity’ feeds. To tailor your feed, select the ‘People’ filter and focus on activities from those you follow.

We strongly encourage you to take advantage of the User Following feature to foster learning and collaboration within our vibrant community.
Who will be the first person you choose to follow? Share your answer in the comments section below and let's inspire each other to explore new horizons together.
您也可以从以下列表中选择网站:
美洲
- América Latina (Español)
- Canada (English)
- United States (English)
欧洲
- Belgium (English)
- Denmark (English)
- Deutschland (Deutsch)
- España (Español)
- Finland (English)
- France (Français)
- Ireland (English)
- Italia (Italiano)
- Luxembourg (English)
- Netherlands (English)
- Norway (English)
- Österreich (Deutsch)
- Portugal (English)
- Sweden (English)
- Switzerland
- United Kingdom(English)
亚太
- Australia (English)
- India (English)
- New Zealand (English)
- 中国
- 日本Japanese (日本語)
- 한국Korean (한국어)