主要内容
Results for
As pointed out in Doxygen comments in code generated with Simulink Embedded Coder - MATLAB Answers - MATLAB Central (mathworks.com), it would be nice that Embedded Coder has an option to generate Doxygen-style comments for signals of buses, i.e.:
/** @brief <Signal desciption here> **/
This would allow static analysis tools to parse the comments. Please add that feature!
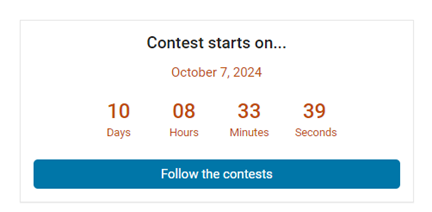
Dear contest participants,
The 2024 Community Contest—MATLAB Shorts Mini Hack—is just one week away! Last year, we challenged you to create a 48-frame, 2-second animation. This year, we're doubling the fun by increasing the frame count to 96 and adding audio support. Your mission? Create a short movie!
As always, whether you are a seasoned MATLAB user or just a beginner, you can participate in the contest and have opportunities to win amazing prizes.
Timeframe:
- The contest will run for 5 weeks, from Oct. 7th to Nov. 10th, Eastern Time.
General Rules:
- The first week is dedicated to entry creation, and the fifth week is reserved for voting only.
- Create a 96-frame, 4-second animation and add audio. We will loop it 3 times to create a 12-second short movie for you.
- The character limit remains at 2,000 characters.
Prizes
- You will have opportunities to win compelling prizes, including Amazon gift cards, MathWorks T-shirts, and virtual badges. We will give out both weekly prizes and grand prizes.
Warm-up!
With one week left before the contest begins, we recommend you warm up by reading a fantastic article: Walkthrough: making Little Nemo's airship in MATLAB by @Tim. The article shares both technical insights and the challenges encountered along the way.
The MATLAB Central Community Team
We are excited to invite you to join our 2024 community contest – MATLAB Shorts Mini Hack! Last year, we challenged you to create a 48-frame animation. In 2024, we are increasing the frame count to 96 and supporting audio. Your mission? Create a short movie!
Whether you are a seasoned MATLAB user or just a beginner, you can participate in the contest and have opportunities to win amazing prizes. Be sure to check out our Blog post for more details on the Community Contests.
Timeframe
This contest runs for 5 weeks, from Oct. 7th to Nov. 10th.
How to Participate
- Create a new short movie or remix an existing one with up to 2,000 characters of code.
- Vote or comment on the short movies you love!
Prizes
You will have opportunities to win compelling prizes, including Amazon gift cards, MathWorks T-shirts, and virtual badges. We will give out both weekly prizes and grand prizes.
Stay Informed
Make sure to follow the contest to get important announcements and your prize updates.
The AI Chat Playground at MATLAB Central has two new upgrades: OpenAI GPT-4o mini and MATLAB R2024b!
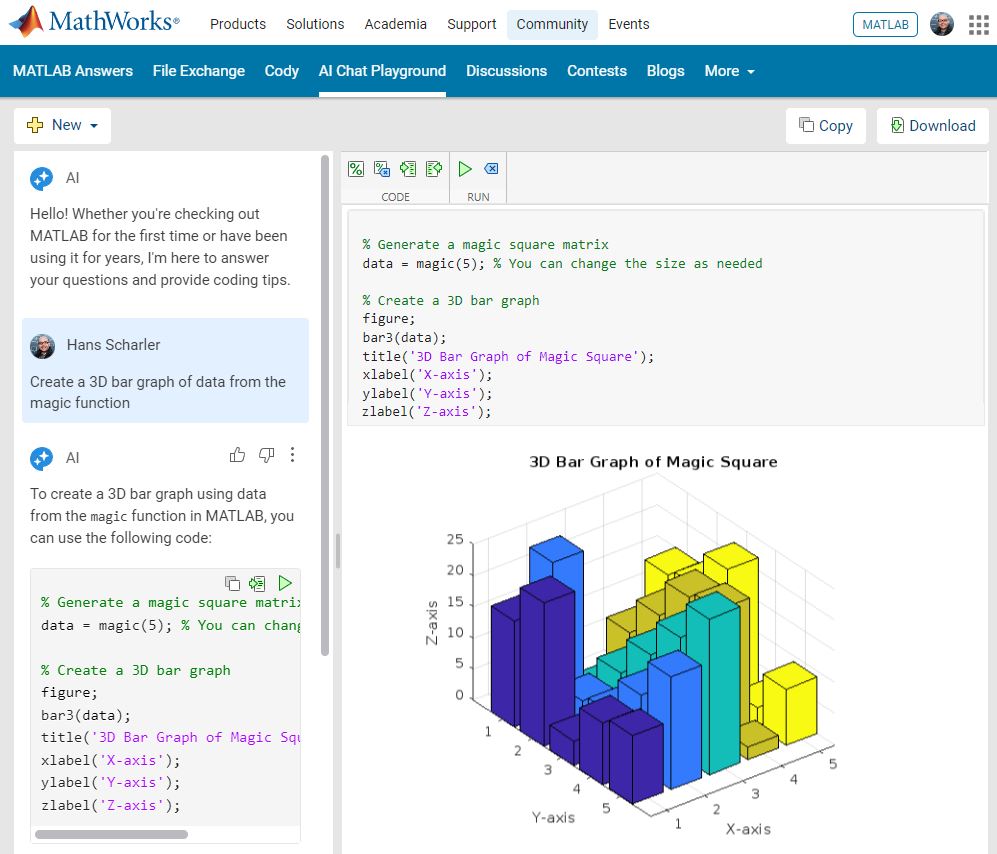
GPT-4o mini is a new language model from OpenAI and brings general knowledge up to October 2023. GPT-4o mini surpasses GPT-3.5 Turbo and other small models on academic benchmarks across both textual intelligence and reasoning. Our goal is to keep improving the output of the AI Chat Playground. This upgrade is available now: https://www.mathworks.com/matlabcentral/playground/
One more thing... we also updated the system to the latest release of MATLAB. This is R2024b and comes with hundreds of updates and new plot types to explore.Check out Mike Croucher's blog post about the latest version of MATLAB: https://blogs.mathworks.com/matlab/2024/09/13/the-latest-version-of-matlab-r2024b-has-just-been-released/
We are looking forward to your feedback on the updates to the AI Chat Playground. Let us know what you think and how you use this community app.
Always!
29%
It depends
14%
Never!
21%
I didn't know that was possible
36%
1810 个投票
Hello everyone,
Over the past few weeks, our community members have shared some incredible insights and resources. Here are some highlights worth checking out:
Interesting Questions
Johnathan is seeking help with implementing a complex equation into MATLAB's curve fitting toolbox. If you have experience with curve fitting or MATLAB, your input could be invaluable!
Popular Discussions
Athanasios continues his exploration of the Duffing Equation, delving into its chaotic behavior. It's a fascinating read for anyone interested in nonlinear dynamics or chaos theory.
John shares his playful exploration with MATLAB to find a generative equation for a sequence involving Fibonacci numbers. It's an intriguing challenge for those who love mathematical puzzles.
From File Exchange
Ayesha provides a graphical analysis of linearised models in epidemiology, offering a detailed look at the dynamics of these systems. This resource is perfect for those interested in mathematical modeling.
Gareth brings some humor to MATLAB with a toolbox designed to share jokes. It's a fun way to lighten the mood during conferences or meetups.
From the Blogs
Ned Gulley interviews Tim Marston, the 2023 MATLAB Mini Hack contest winner. Tim's creativity and skills are truly inspiring, and his story is a must-read for aspiring programmers.
Sivylla discusses the integration of AI with embedded systems, highlighting the benefits of using MATLAB and Simulink. It's an insightful read for anyone interested in the future of AI technology.
Thank you to all our contributors for sharing your knowledge and creativity. We encourage everyone to engage with these posts and continue fostering a vibrant and supportive community.
Happy exploring!
Explore the newest online training courses, available as of 2024b: one new Onramp, eight new short courses, and one new learning path. Yes, that’s 10 new offerings. We’ve been busy.
As a reminder, Onramps are free to all. Short courses and learning paths require a subscription to the Online Training Suite (OTS).
- Multibody Simulation Onramp
- Analyzing Results in Simulink
- Battery Pack Modeling
- Introduction to Motor Control
- Signal Processing Techniques for Streaming Signals
- Core Signal Processing Techniques in MATLAB (learning path – includes the four short courses listed below)
Dear MATLAB contest enthusiasts,
In the 2023 MATLAB Mini Hack Contest, Tim Marston captivated everyone with his incredible animations, showcasing both creativity and skill, ultimately earning him the 1st prize.
We had the pleasure of interviewing Tim to delve into his inspiring story. You can read the full interview on MathWorks Blogs: Community Q&A – Tim Marston.
Last question: Are you ready for this year’s Mini Hack contest?
As far as I know, starting from MATLAB R2024b, the documentation is defaulted to be accessed online. However, the problem is that every time I open the official online documentation through my browser, it defaults or forcibly redirects to the documentation hosted site for my current geographic location, often with multiple pop-up reminders, which is very annoying!
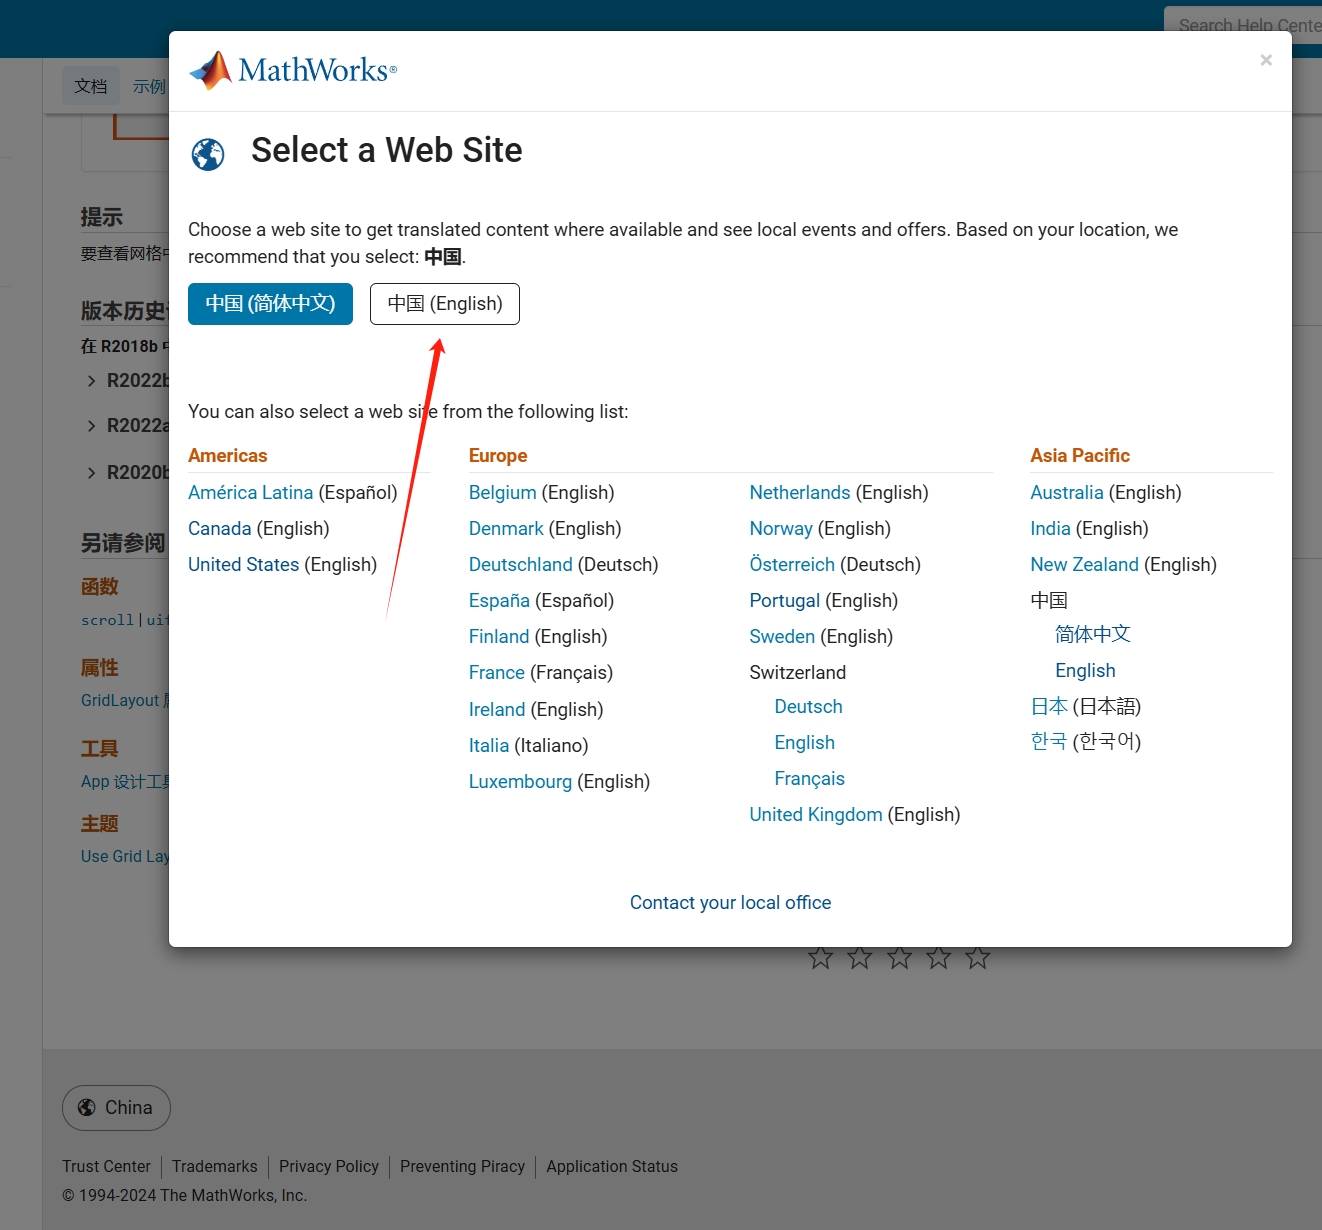
Suggestion: Could there be an option to set preferences linked to my personal account so that the documentation defaults to my chosen language preference without having to deal with “forced reminders” or “forced redirection” based on my geographic location? I prefer reading the English documentation, but the website automatically redirects me to the Chinese documentation due to my geolocation, which is quite frustrating!
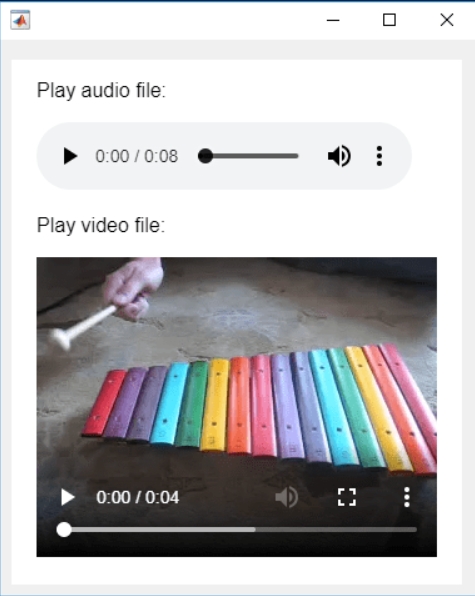
In the past two years, MATHWORKS has updated the image viewer and audio viewer, giving them a more modern interface with features like play, pause, fast forward, and some interactive tools that are more commonly found in typical third-party players. However, the video player has not seen any updates. For instance, the Video Viewer or vision.VideoPlayer could benefit from a more modern player interface. Perhaps I haven't found a suitable built-in player yet. It would be great if there were support for custom image processing and audio processing algorithms that could be played in a more modern interface in real time.
Additionally, I found it quite challenging to develop a modern video player from scratch in App Designer.(If there's a video component for that that would be great)
-----------------------------------------------------------------------------------------------------------------
BTW,the following picture shows the built-in function uihtml function showing a more modern playback interface with controls for play, pause and so on. But can not add real-time image processing algorithms within it.
isequaln exists to return true when NaN==NaN.
unique treats NaN==NaN as false (as it should) requiring NaN to be replaced if NaN is not considered unique in a particular application. In my application, I am checking uniqueness of table rows using [table_unique,index_unique]=unique(table,"rows","sorted") and would prefer to keep NaN as NaN or missing in table_unique without the overhead of replacing it with a dummy value then replacing it again. Dummy values also have the risk of matching existing values in the table, requiring first finding a dummy value that is not in the table.
uniquen (similar to isequaln) would be more eloquent.
Please point out if I am missing something!
Swimming, diving
16%
Other water-based sport
4%
Gymnastics
20%
Other indoor arena sport
15%
track, field
24%
Other outdoor sport
21%
346 个投票
Hello, MATLAB enthusiasts! 🌟
Over the past few weeks, our community has been buzzing with insightful questions, vibrant discussions, and innovative ideas. Whether you're a seasoned expert or a curious beginner, there's something here for everyone to learn and enjoy. Let's take a moment to highlight some of the standout contributions that have sparked interest and inspired many. Dive in and see how you can join the conversation or find solutions to your own challenges!
Interesting Questions
How can i edit my code which works on r2014b version at work but not on my personal r2024a version? by Oluwadamilola Oke
Oluwadamilola Oke is seeking assistance with a MATLAB code that works on version r2014b but encounters errors on version r2024a. The issue seems to be related to file location or the use of specific commands like movefile. If you have experience with these versions of MATLAB, your expertise could be invaluable.
Yohay has been working on a simulation to measure particle speed and fit it to the Maxwell-Boltzmann distribution. However, the fit isn't aligning perfectly with the data. Yohay has shared the code and histogram data for community members to review and provide suggestions.
Alessandro Livi is toggling between C++ for Arduino Pico and MATLAB App Designer. They suggest an enhancement where typing // for comments in MATLAB automatically converts to %. This small feature could improve the workflow for many users who switch between programming languages.
Popular Discussions
Athanasios Paraskevopoulos has started an engaging discussion on Gabriel's Horn, a shape with infinite surface area but finite volume. The conversation delves into the mathematical intricacies and integral calculations required to understand this paradoxical shape.
Honzik has brought up an interesting topic about custom fonts for MATLAB. While popular coding fonts handle characters like 0 and O well, they often fail to distinguish between different types of brackets. Honzik suggests that MathWorks could develop a custom font optimized for MATLAB syntax to reduce coding errors.
From the Blogs
Guy Rouleau addresses a common error in Simulink models: "Derivative of state '1' in block 'X/Y/Integrator' at time 0.55 is not finite." The blog post explores various tools and methods to diagnose and resolve this issue, making it a valuable read for anyone facing similar challenges.
Guest writer Gianluca Carnielli, featured by Adam Danz, shares insights on creating time-sensitive animations using MATLAB. The article covers controlling the motion of multiple animated objects, organizing data with timetables, and simplifying animations with the retime function. This is a must-read for anyone interested in scientific animations.
Feel free to check out these fascinating contributions and join the discussions! Your input and expertise can make a significant difference in our community.
Something that had bothered me ever since I became an FEA analyst (2012) was the apparent inability of the "camera" in Matlab's 3D plot to function like the "cameras" in CAD/CAE packages.
For instance, load the ForearmLink.stl model that ships with the PDE Toolbox in Matlab and ParaView and try rotating the model.
clear
close all
gm = importGeometry( "ForearmLink.stl" );
pdegplot(gm)
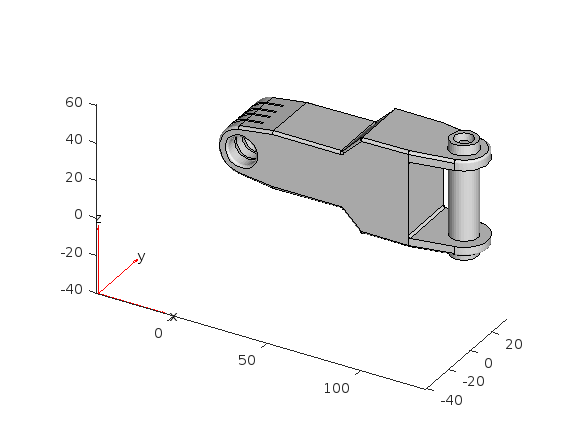
Things to observe:
- Note that I cant seem to rotate continuously around the x-axis. It appears to only support rotations from [0, 360] as opposed to [-inf, inf]. So, for example, if I'm looking in the Y+ direction and rotate around X so that I'm looking at the Z- direction, and then want to look in the Y- direction, I can't simply keep rotating around the X axis... instead have to rotate 180 degrees around the Z axis and then around the X axis. I'm not aware of any data visualization applications (e.g., ParaView, VisIt, EnSight) or CAD/CAE tools with such an interaction.
- Note that at the 50 second mark, I set a view in ParaView: looking in the [X-, Y-, Z-] direction with Y+ up. Try as I might in Matlab, I'm unable to achieve that same view perspective.
Today I discovered that if one turns on the Camera Toolbar from the View menubar, then clicks the Orbit Camera icon, then the No Principal Axis icon:
That then it acts in the manner I've long desired. Oh, and also, for the interested, it is programmatically available: https://www.mathworks.com/help/matlab/ref/cameratoolbar.html
I might humbly propose this mode either be made more discoverable, similar to the little interaction widgets that pop up in figures:
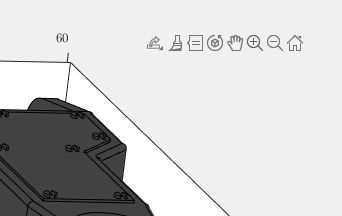
Or maybe use the middle-mouse button to temporarily use this mode (a mouse setting in, e.g., Abaqus/CAE).
I've noticed is that the highly rated fonts for coding (e.g. Fira Code, Inconsolata, etc.) seem to overlook one issue that is key for coding in Matlab. While these fonts make 0 and O, as well as the 1 and l easily distinguishable, the brackets are not. Quite often the curly bracket looks similar to the curved bracket, which can lead to mistakes when coding or reviewing code.
So I was thinking: Could Mathworks put together a team to review good programming fonts, and come up with their own custom font designed specifically and optimized for Matlab syntax?
An option for 10th degree polynomials but no weighted linear least squares. Seriously? Jesse
Hello, everyone! I’m Mark Hayworth, but you might know me better in the community as Image Analyst. I've been using MATLAB since 2006 (18 years). My background spans a rich career as a former senior scientist and inventor at The Procter & Gamble Company (HQ in Cincinnati). I hold both master’s & Ph.D. degrees in optical sciences from the College of Optical Sciences at the University of Arizona, specializing in imaging, image processing, and image analysis. I have 40+ years of military, academic, and industrial experience with image analysis programming and algorithm development. I have experience designing custom light booths and other imaging systems. I also work with color and monochrome imaging, video analysis, thermal, ultraviolet, hyperspectral, CT, MRI, radiography, profilometry, microscopy, NIR, and Raman spectroscopy, etc. on a huge variety of subjects.
I'm thrilled to participate in MATLAB Central's Ask Me Anything (AMA) session, a fantastic platform for knowledge sharing and community engagement. Following Adam Danz’s insightful AMA on staff contributors in the Answers forum, I’d like to discuss topics in the area of image analysis and processing. I invite you to ask me anything related to this field, whether you're seeking recommendations on tools, looking for tips and tricks, my background, or career development advice. Additionally, I'm more than willing to share insights from my experiences in the MATLAB Answers community, File Exchange, and my role as a member of the Community Advisory Board. If you have questions related to your specific images or your custom MATLAB code though, I'll invite you to ask those in the Answers forum. It's a more appropriate forum for those kinds of questions, plus you can get the benefit of other experts offering their solutions in addition to me.
For the coming weeks, I'll be here to engage with your questions and help shed light on any topics you're curious about.
Hello, everyone!
Over the past few weeks, our community has been buzzing with activity, showcasing the incredible depth of knowledge, creativity, and innovation that makes this forum such a vibrant place. Today, we're excited to highlight some of the noteworthy contributions that have sparked discussions, offered insights, and shared knowledge across various topics. Let's dive in!
Interesting Questions
Fatima Majeed brings us a thought-provoking mathematical challenge, delving into inequalities and the realms beyond (e^e). If you're up for a mathematical journey, this question is a must-see!
lil brain tackles a practical problem many of us have faced: efficiently segmenting a CSV file based on specific criteria. This post is not only a query but a learning opportunity for anyone dealing with similar data manipulation challenges.
Popular Discussions
Discover a simple yet effective trick for digit manipulation from goc3. This tip is especially handy for those frequenting Cody challenges or anyone interested in enhancing their number handling skills in MATLAB.
Chen Lin shares an exciting update about the 'Run Code' feature in the Discussions area, highlighting how our community can now directly execute and share code snippets within discussions. This feature marks a significant enhancement in how we interact and solve problems together.
From the Blogs
A Deep Dive into EEG Analysis for Predicting Neurological Outcomes By Tanya Kuruvilla
Connell D`Souza, alongside Team Swarthbeat, explores the cutting-edge application of EEG analysis in predicting neurological outcomes post-cardiac arrest. This blog post offers an in-depth look into the challenges and methodologies of modern medical data analysis.
Mihir Acharya discusses the pivotal role of MATLAB and Simulink in the future of robotics simulation. Through an engaging conversation with industry analyst George Chowdhury, this post sheds light on overcoming simulation challenges and the exciting possibilities that lie ahead.
We encourage everyone to explore these contributions further and engage with the authors and the community. Your participation is what fuels this community's continual growth and innovation.
Here's to many more discussions, discoveries, and breakthroughs together!
We're thrilled to share an exciting update with our community: the 'Run Code' feature is now available in the Discussions area!
Simply insert your code into the editor and press the green triangle button to run it. Your code will execute using the latest MATLAB R24a version, and it supports most common toolboxes. Moreover, this innovative feature allows for the running of attached files, further enhancing its utility and flexibility.
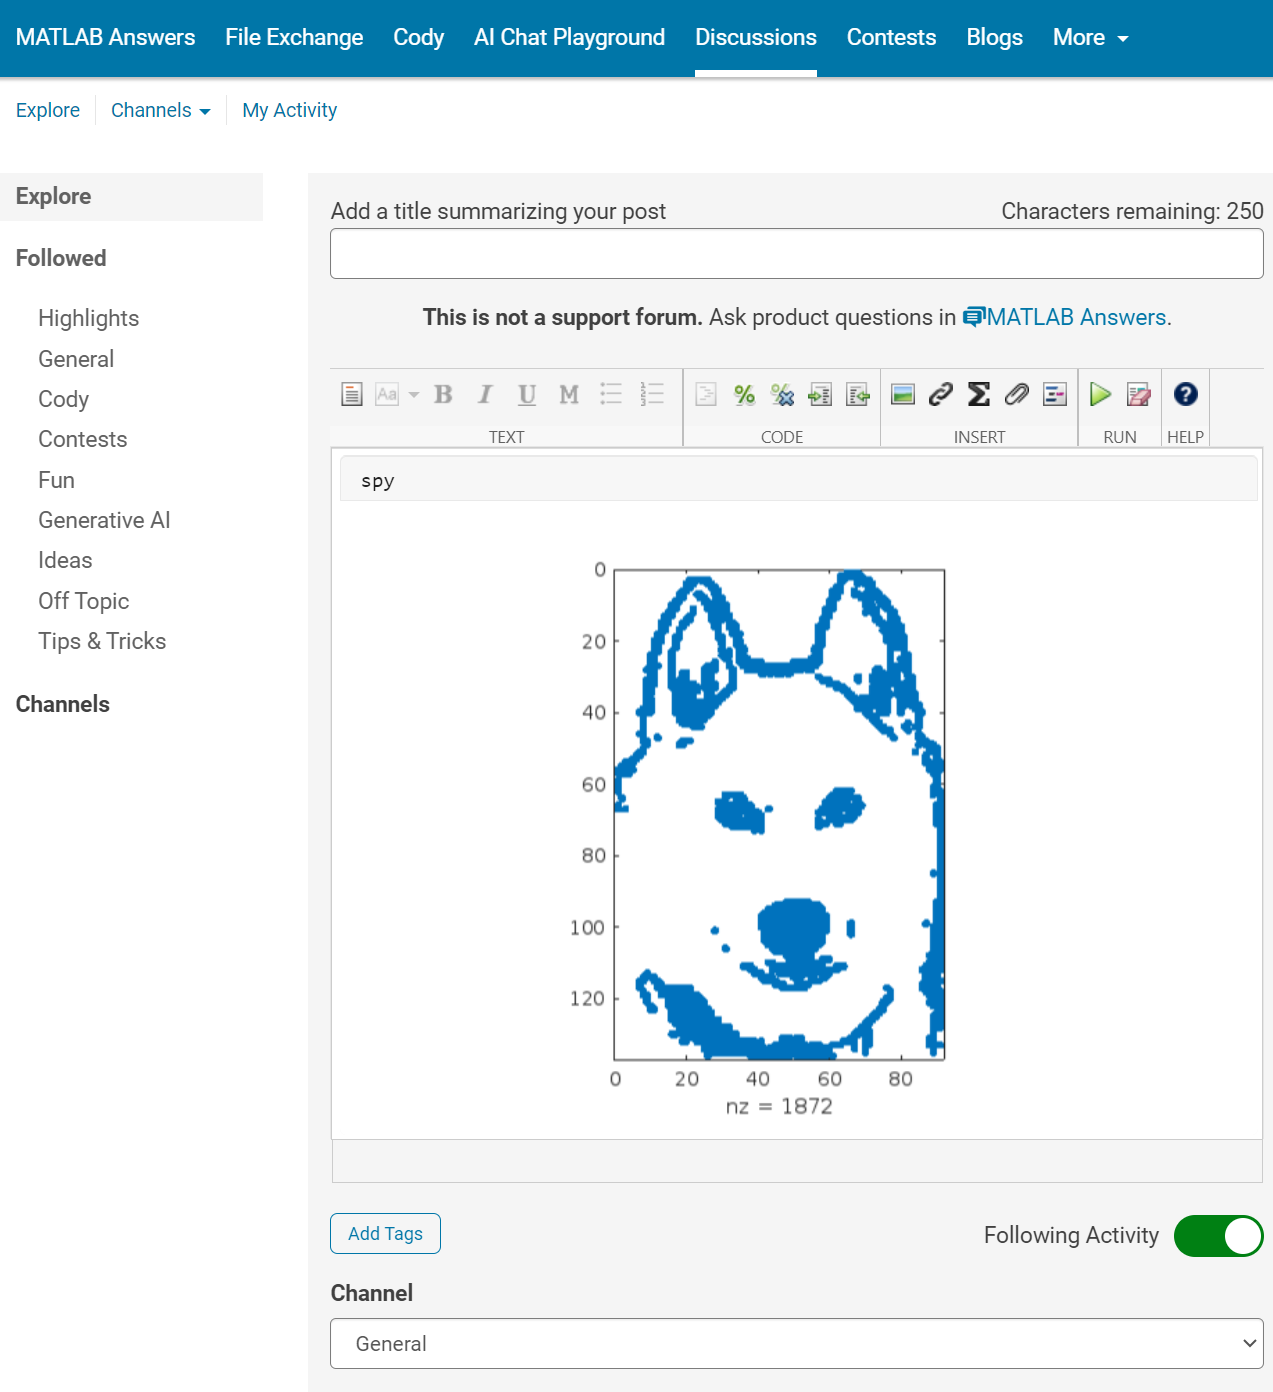
The ‘run code’ feature was first introduced in MATLAB Answers. Encouraged by the positive feedback and at the request of our community members, we are now expanding the availability of this feature to more areas within our community.
As always, your feedback is crucial to us, so please don't hesitate to share your thoughts and experiences by leaving a comment.
Many MATLAB enthusiasts come Cody to sharpen their skills, face new challenges, and engage in friendly competition. We firmly believe that learning from peers is one of the most effective ways to grow.
With this in mind, the Cody team is thrilled to unveil a new feature aimed at enriching your learning journey: the Cody Discussion Channel. This space is designed for sharing expertise, acquiring new skills, and fostering connections within our community.
On the Cody homepage, you'll now notice a Discussions section, prominently displaying the four most recent posts. For those eager to contribute, we encourage you to familiarize yourself with our posting guidelines before creating a new post. This will help maintain a constructive and valuable exchange of ideas for everyone involved.
Together, let's create an environment where every member feels empowered to share, learn, and connect.
您也可以从以下列表中选择网站:
美洲
- América Latina (Español)
- Canada (English)
- United States (English)
欧洲
- Belgium (English)
- Denmark (English)
- Deutschland (Deutsch)
- España (Español)
- Finland (English)
- France (Français)
- Ireland (English)
- Italia (Italiano)
- Luxembourg (English)
- Netherlands (English)
- Norway (English)
- Österreich (Deutsch)
- Portugal (English)
- Sweden (English)
- Switzerland
- United Kingdom(English)
亚太
- Australia (English)
- India (English)
- New Zealand (English)
- 中国
- 日本Japanese (日本語)
- 한국Korean (한국어)