主要内容
Results for
An option for 10th degree polynomials but no weighted linear least squares. Seriously? Jesse
What do you think about the NVIDIA's achivement of becoming the top giant of manufacturing chips, especially for AI world?

Spring is here in Natick and the tulips are blooming! While tulips appear only briefly here in Massachusetts, they provide a lot of bright and diverse colors and shapes. To celebrate this cheerful flower, here's some code to create your own tulip!

One of the starter prompts is about rolling two six-sided dice and plot the results. As a hobby, I create my own board games. I was able to use the dice rolling prompt to show how a simple roll and move game would work. That was a great surprise!
Drumlin Farm has welcomed MATLAMB, named in honor of MathWorks, among ten adorable new lambs this season!

I found this plot of words said by different characters on the US version of The Office sitcom. There's a sparkline for each character from pilot to finale episode.
A high school student called for help with this physics problem:

- Car A moves with constant velocity v.
- Car B starts to move when Car A passes through the point P.
- Car B undergoes...
- uniform acc. motion from P to Q.
- uniform velocity motion from Q to R.
- uniform acc. motion from R to S.
- Car A and B pass through the point R simultaneously.
- Car A and B arrive at the point S simultaneously.
Q1. When car A passes the point Q, which is moving faster?
Q2. Solve the time duration for car B to move from P to Q using L and v.
Q3. Magnitude of acc. of car B from P to Q, and from R to S: which is bigger?
Well, it can be solved with a series of tedious equations. But... how about this?

Code below:
%% get images and prepare stuffs
figure(WindowStyle="docked"),
ax1 = subplot(2,1,1);
hold on, box on
ax1.XTick = [];
ax1.YTick = [];
A = plot(0, 1, 'ro', MarkerSize=10, MarkerFaceColor='r');
B = plot(0, 0, 'bo', MarkerSize=10, MarkerFaceColor='b');
[carA, ~, alphaA] = imread('https://cdn.pixabay.com/photo/2013/07/12/11/58/car-145008_960_720.png');
[carB, ~, alphaB] = imread('https://cdn.pixabay.com/photo/2014/04/03/10/54/car-311712_960_720.png');
carA = imrotate(imresize(carA, 0.1), -90);
carB = imrotate(imresize(carB, 0.1), 180);
alphaA = imrotate(imresize(alphaA, 0.1), -90);
alphaB = imrotate(imresize(alphaB, 0.1), 180);
carA = imagesc(carA, AlphaData=alphaA, XData=[-0.1, 0.1], YData=[0.9, 1.1]);
carB = imagesc(carB, AlphaData=alphaB, XData=[-0.1, 0.1], YData=[-0.1, 0.1]);
txtA = text(0, 0.85, 'A', FontSize=12);
txtB = text(0, 0.17, 'B', FontSize=12);
yline(1, 'r--')
yline(0, 'b--')
xline(1, 'k--')
xline(2, 'k--')
text(1, -0.2, 'Q', FontSize=20, HorizontalAlignment='center')
text(2, -0.2, 'R', FontSize=20, HorizontalAlignment='center')
% legend('A', 'B') % this make the animation slow. why?
xlim([0, 3])
ylim([-.3, 1.3])
%% axes2: plots velocity graph
ax2 = subplot(2,1,2);
box on, hold on
xlabel('t'), ylabel('v')
vA = plot(0, 1, 'r.-');
vB = plot(0, 0, 'b.-');
xline(1, 'k--')
xline(2, 'k--')
xlim([0, 3])
ylim([-.3, 1.8])
p1 = patch([0, 0, 0, 0], [0, 1, 1, 0], [248, 209, 188]/255, ...
EdgeColor = 'none', ...
FaceAlpha = 0.3);
%% solution
v = 1; % car A moves with constant speed.
L = 1; % distances of P-Q, Q-R, R-S
% acc. of car B for three intervals
a(1) = 9*v^2/8/L;
a(2) = 0;
a(3) = -1;
t_BatQ = sqrt(2*L/a(1)); % time when car B arrives at Q
v_B2 = a(1) * t_BatQ; % speed of car B between Q-R
%% patches for velocity graph
p2 = patch([t_BatQ, t_BatQ, t_BatQ, t_BatQ], [1, 1, v_B2, v_B2], ...
[248, 209, 188]/255, ...
EdgeColor = 'none', ...
FaceAlpha = 0.3);
p3 = patch([2, 2, 2, 2], [1, v_B2, v_B2, 1], [194, 234, 179]/255, ...
EdgeColor = 'none', ...
FaceAlpha = 0.3);
%% animation
tt = linspace(0, 3, 2000);
for t = tt
A.XData = v * t;
vA.XData = [vA.XData, t];
vA.YData = [vA.YData, 1];
if t < t_BatQ
B.XData = 1/2 * a(1) * t^2;
vB.XData = [vB.XData, t];
vB.YData = [vB.YData, a(1) * t];
p1.XData = [0, t, t, 0];
p1.YData = [0, vB.YData(end), 1, 1];
elseif t >= t_BatQ && t < 2
B.XData = L + (t - t_BatQ) * v_B2;
vB.XData = [vB.XData, t];
vB.YData = [vB.YData, v_B2];
p2.XData = [t_BatQ, t, t, t_BatQ];
p2.YData = [1, 1, vB.YData(end), vB.YData(end)];
else
B.XData = 2*L + v_B2 * (t - 2) + 1/2 * a(3) * (t-2)^2;
vB.XData = [vB.XData, t];
vB.YData = [vB.YData, v_B2 + a(3) * (t - 2)];
p3.XData = [2, t, t, 2];
p3.YData = [1, 1, vB.YData(end), v_B2];
end
txtA.Position(1) = A.XData(end);
txtB.Position(1) = B.XData(end);
carA.XData = A.XData(end) + [-.1, .1];
carB.XData = B.XData(end) + [-.1, .1];
drawnow
end
is there any sites available online free ai course learning except: coursera.org
Updating some of my educational Livescripts to 2024a, really love the new "define a function anywhere" feature, and have a "new" idea for improving Livescripts -- support "hidden" code blocks similar to the Jupyter Notebooks functionality.
For example, I often create "complicated" plots with a bunch of ancillary items and I don't want this code exposed to the reader by default, as it might confuse the reader. For example, consider a Livescript that might read like this:
-----
Noting the similar structure of these two mappings, let's now write a function that simply maps from some domain to some other domain using change of variable.
function x = ChangeOfVariable( x, from_domain, to_domain )
x = x - from_domain(1);
x = x * ( ( to_domain(2) - to_domain(1) ) / ( from_domain(2) - from_domain(1) ) );
x = x + to_domain(1);
end
Let's see this function in action
% HIDE CELL
clear
close all
from_domain = [-1, 1];
to_domain = [2, 7];
from_values = [-1, -0.5, 0, 0.5, 1];
to_values = ChangeOfVariable( from_values, from_domain, to_domain )
to_values = 1×5
2.0000 3.2500 4.5000 5.7500 7.0000
We can plot the values of from_values and to_values, showing how they're connected to each other:
% HIDE CELL
figure
hold on
for n = 1 : 5
plot( [from_values(n) to_values(n)], [1 0], Color="k", LineWidth=1 )
end
ax = gca;
ax.YTick = [];
ax.XLim = [ min( [from_domain, to_domain] ) - 1, max( [from_domain, to_domain] ) + 1 ];
ax.YLim = [-0.5, 1.5];
ax.XGrid = "on";
scatter( from_values, ones( 5, 1 ), Marker="s", MarkerFaceColor="flat", MarkerEdgeColor="k", SizeData=120, LineWidth=1, SeriesIndex=1 )
text( mean( from_domain ), 1.25, "$\xi$", Interpreter="latex", HorizontalAlignment="center", VerticalAlignment="middle" )
scatter( to_values, zeros( 5, 1 ), Marker="o", MarkerFaceColor="flat", MarkerEdgeColor="k", SizeData=120, LineWidth=1, SeriesIndex=2 )
text( mean( to_domain ), -0.25, "$x$", Interpreter="latex", HorizontalAlignment="center", VerticalAlignment="middle" )
scaled_arrow( ax, [mean( [from_domain(1), to_domain(1) ] ) - 1, 0.5], ( 1 - 0 ) / ( from_domain(1) - to_domain(1) ), 1 )
scaled_arrow( ax, [mean( [from_domain(end), to_domain(end)] ) + 1, 0.5], ( 1 - 0 ) / ( from_domain(end) - to_domain(end) ), -1 )
text( mean( [from_domain(1), to_domain(1) ] ) - 1.5, 0.5, "$x(\xi)$", Interpreter="latex", HorizontalAlignment="center", VerticalAlignment="middle" )
text( mean( [from_domain(end), to_domain(end)] ) + 1.5, 0.5, "$\xi(x)$", Interpreter="latex", HorizontalAlignment="center", VerticalAlignment="middle" )

-----
Where scaled_arrow is some utility function I've defined elsewhere... See how a majority of the code is simply "drivel" to create the plot, clear and close? I'd like to be able to hide those cells so that it would look more like this:
-----
Noting the similar structure of these two mappings, let's now write a function that simply maps from some domain to some other domain using change of variable.
function x = ChangeOfVariable( x, from_domain, to_domain )
x = x - from_domain(1);
x = x * ( ( to_domain(2) - to_domain(1) ) / ( from_domain(2) - from_domain(1) ) );
x = x + to_domain(1);
end
Let's see this function in action
▶ Show code cell
from_domain = [-1, 1];
to_domain = [2, 7];
from_values = [-1, -0.5, 0, 0.5, 1];
to_values = ChangeOfVariable( from_values, from_domain, to_domain )
to_values = 1×5
2.0000 3.2500 4.5000 5.7500 7.0000
We can plot the values of from_values and to_values, showing how they're connected to each other:
▶ Show code cell

-----
Thoughts?
I recently had issues with code folding seeming to disappear and it turns out that I had unknowingly disabled the "show code folding margin" option by accident. Despite using MATLAB for several years, I had no idea this was an option, especially since there seemed to be no references to it in the code folding part of the "Preferences" menu.
It would be great if in the future, there was a warning that told you about this when you try enable/disable folding in the Preferences.
I am using 2023b by the way.
In the MATLAB editor, when clicking on a variable name, all the other instances of the variable name will be highlighted.
But this does not work for structure fields, which is a pity. Such feature would be quite often useful for me.
I show an illustration below, and compare it with Visual Studio Code that does it. ;-)
I am using MATLAB R2023a, sorry if it has been added to newer versions, but I didn't see it in the release notes.

Dear members, I’m currently doing research on the subject of using Generative A.I. as a digital designer. What our research group would like to know is which ethical issues have a big impact on the decisions you guys and girls make using generative A.I.
Whether you’re using A.I. or not, we would really like to know your vision and opinion about this subject. Please empty your thoughts and oppinion into your answers, we would like to get as much information as possible.
Are you currently using A.I. when doing your job? Yes, what for. No (not yet), why not?
Using A.I., would you use real information or alter names/numbers to get an answer?
What information would or wouldn’t you use? If the client is asking/ordering you to do certain things that go against your principles, would you still do it because order is order? How far would you go?
Who is responsible for the outcome of the generated content, you or the client?
Would you still feel like a product owner if it was co-developed with A.I.?
What we are looking for is that we would like to know why people do or don’t use AI in the field of design and wich ethical considerations they make. We’re just looking for general moral line of people, for example: 70% of designers don’t feel owner of a design that is generated by AI but 95% feels owner when it is co-created.
So therefore the questions we asked, we want to know the how you feel about this.
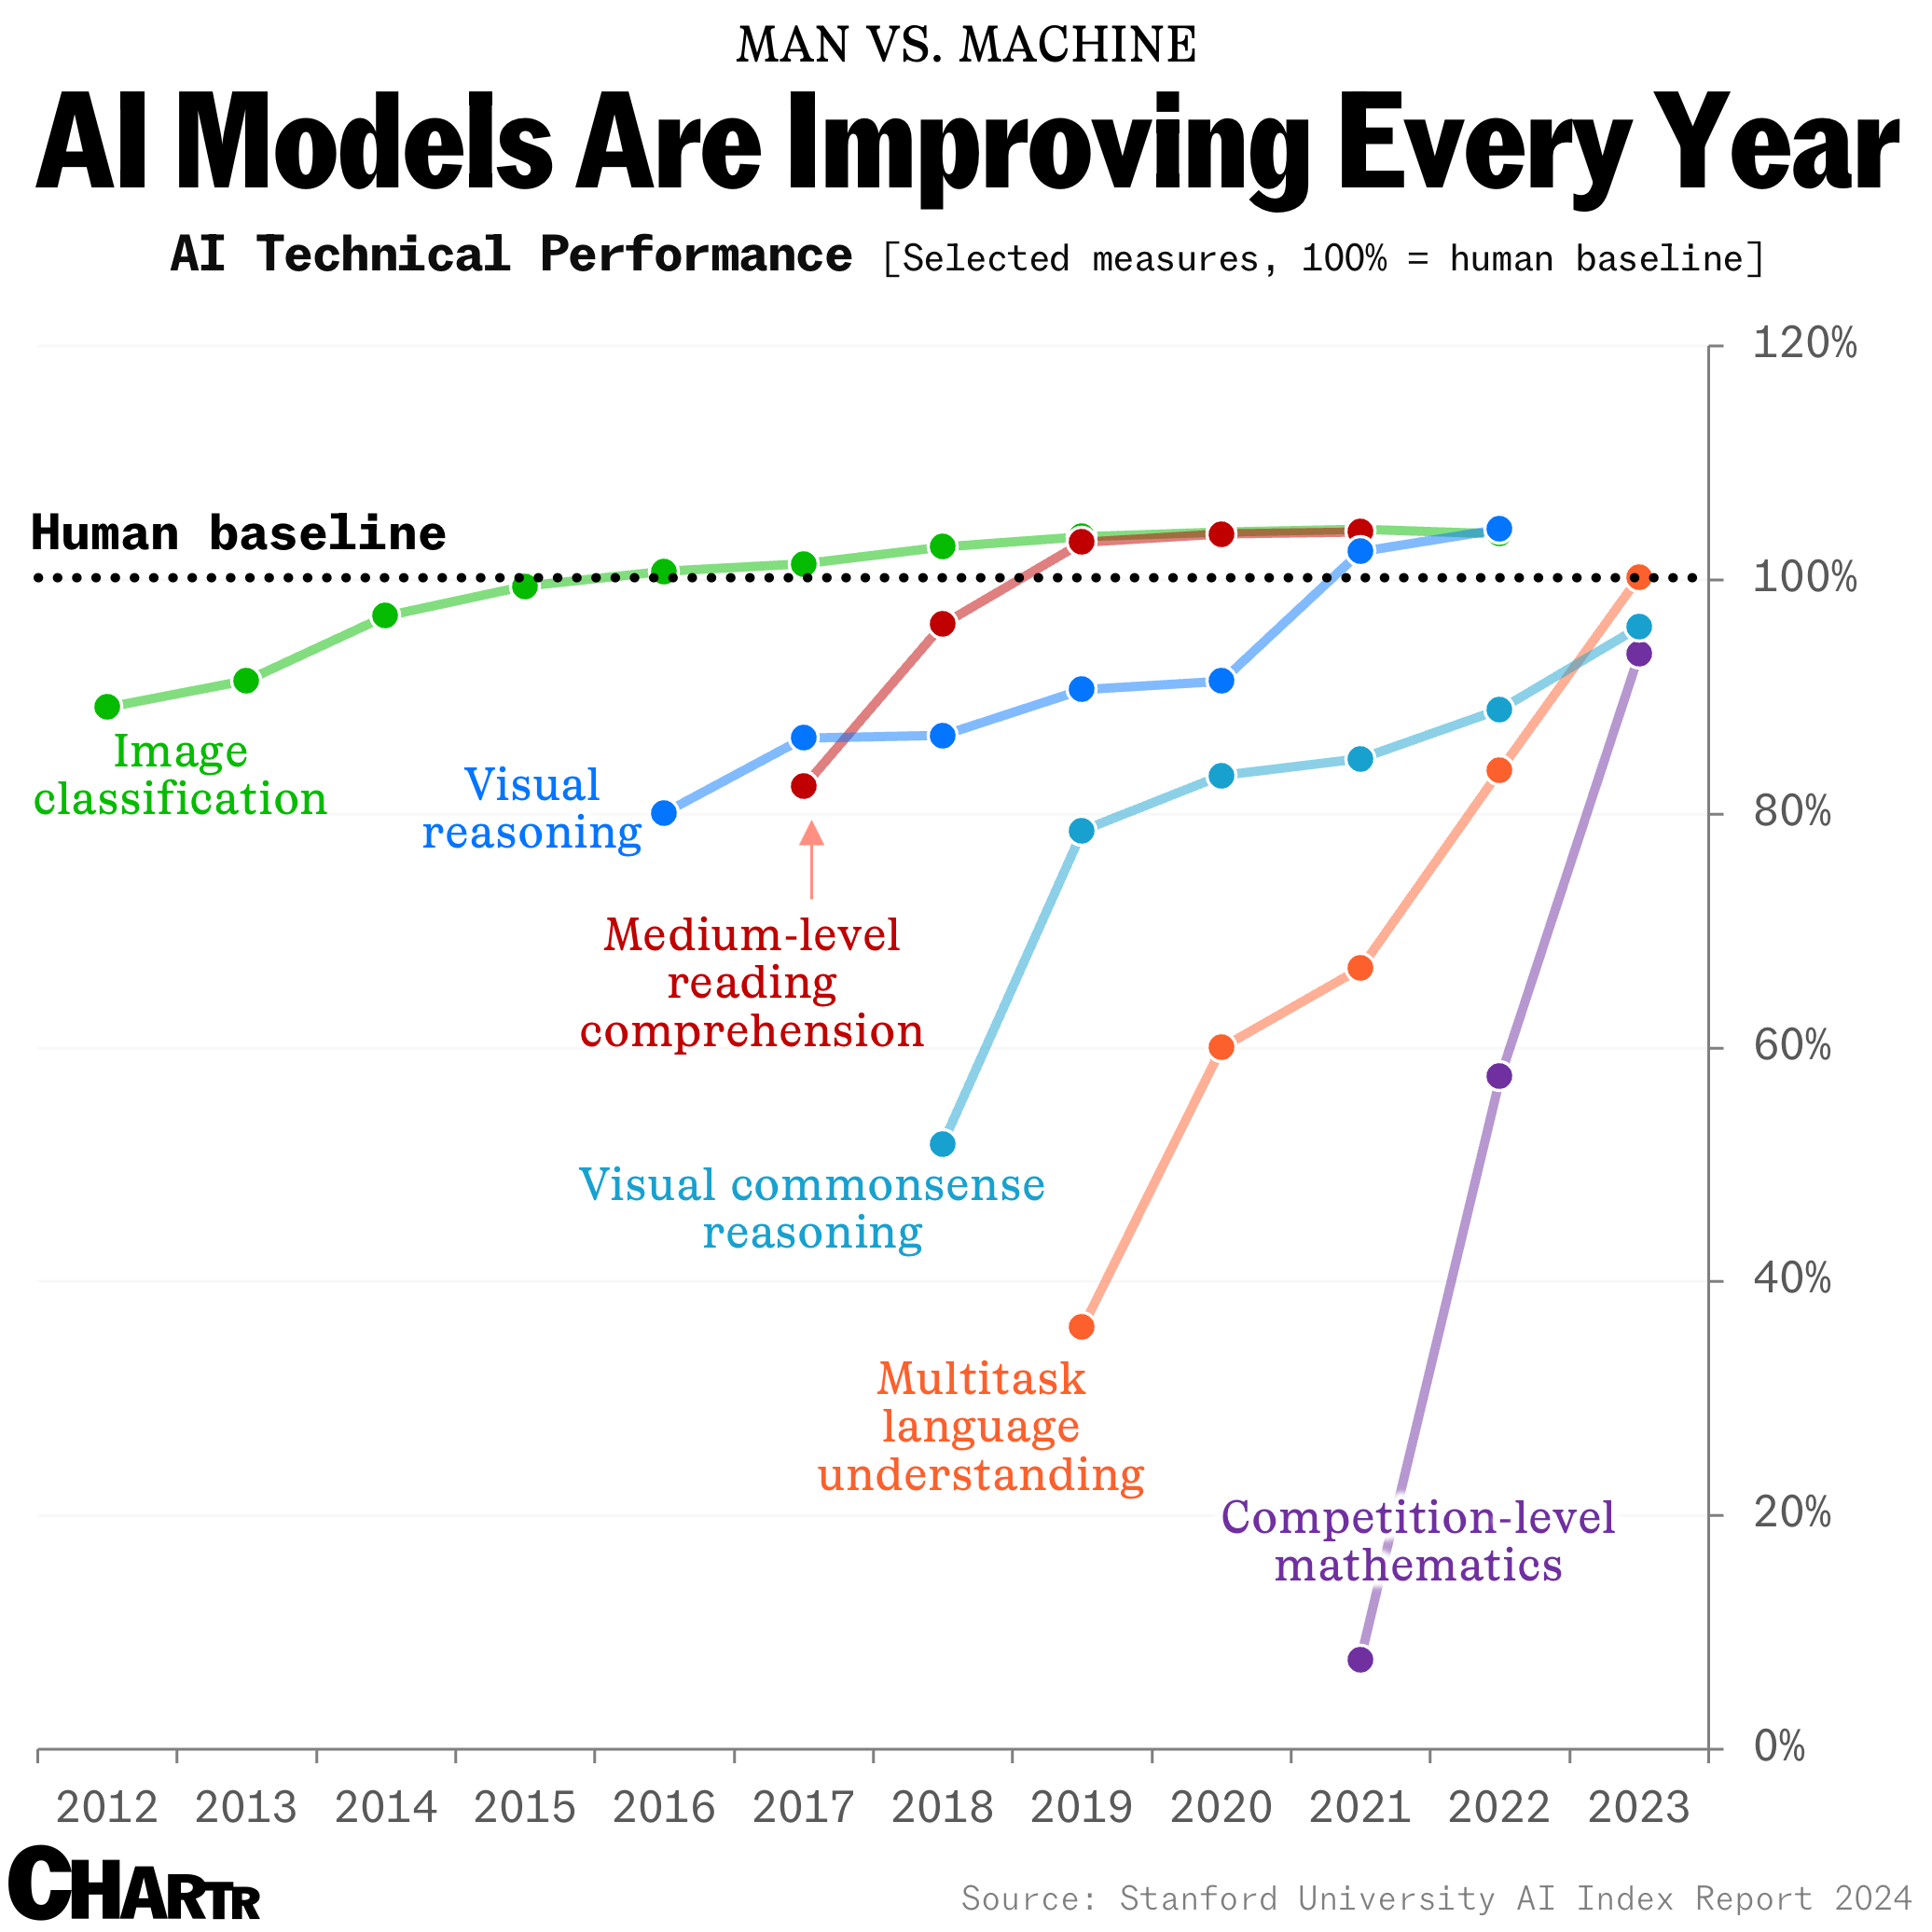
How long until the 'dumbest' models are smarter than your average person? Thanks for sharing this article @Adam Danz
What's your way?

Mari is helping Dad work.

Today, he got dressed for work to design some new dog toy-making algorithms. #nationalpetday

Transforming my furry friend into a grayscale masterpiece with MATLAB! 🐾 #MATLABPetsDay ✌️


This is Stella while waiting to see if the code works...

MatGPT was launched on March 22, 2023 and I am amazed at how many times it has been downloaded since then - close to 16,000 downloads in one year. When AI Chat Playground came out on MATLAB Central, I thought surely that people will stop using MatGPT. Boy I was wrong.
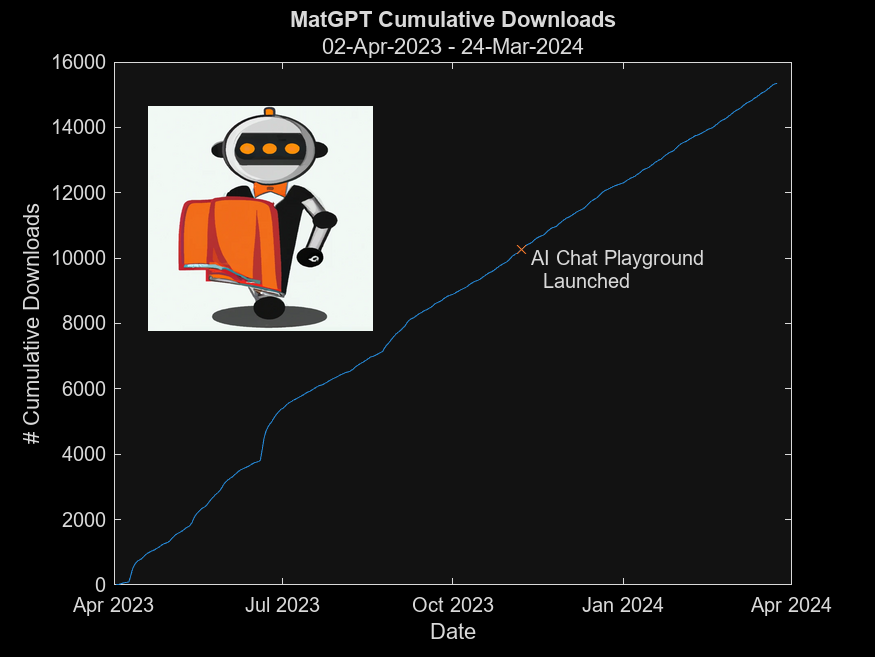
In early 2023 I was playing with the new shiny toy called ChatGPT like everyone else but instead of having it tell me jokes or haiku, I wanted to know how I can use it on MATLAB, and I started collecting the prompts that worked. Someone suggested I should turn that into an app, and MatGPT was born with help from other colleagues.
Here is the question - what should I do with it now? Some people suggested I could add other LLMs like Gemini or Claude, but I am more interested in learning how people actually use it.
If you are a MatGPT user, do you mind sharing how you use the app?
In short: support varying color in at least the plot, plot3, fplot, and fplot3 functions.
This has been a thing that's come up quite a few times, and includes questions/requests by users, workarounds by the community, and workarounds presented by MathWorks -- examples of each below. It's a feature that exists in Python's Matplotlib library and Sympy. Anyways, given that there are myriads of workarounds, it appears to be one of the most common requests for Matlab plots (Matlab's plotting is, IMO, one of the best features of the product), the request precedes the 21st century, and competitive tools provide the functionality, it would seem to me that this might be the next great feature for Matlab plotting.
I'm curious to get the rest of the community's thoughts... what's everyone else think about this?
---
User questions/requests
- https://www.mathworks.com/matlabcentral/answers/480389-colored-line-plot-according-to-a-third-variable
- https://www.mathworks.com/matlabcentral/answers/2092641-how-to-solve-a-problem-with-the-generation-of-multiple-colored-segments-on-one-line-in-matlab-plot
- https://www.mathworks.com/matlabcentral/answers/5042-how-do-i-vary-color-along-a-2d-line
- https://www.mathworks.com/matlabcentral/answers/1917650-how-to-plot-a-trajectory-with-varying-colour
- https://www.mathworks.com/matlabcentral/answers/1917650-how-to-plot-a-trajectory-with-varying-colour
- https://www.mathworks.com/matlabcentral/answers/511523-how-to-create-plot3-varying-color-figure
- https://www.mathworks.com/matlabcentral/answers/393810-multiple-colours-in-a-trajectory-plot
- https://www.mathworks.com/matlabcentral/answers/523135-creating-a-rainbow-colour-plot-trajectory
- https://www.mathworks.com/matlabcentral/answers/469929-how-to-vary-the-color-of-a-dynamic-line
- https://www.mathworks.com/matlabcentral/answers/585011-how-could-i-adjust-the-color-of-multiple-lines-within-a-graph-without-using-the-default-matlab-colo
- https://www.mathworks.com/matlabcentral/answers/517177-how-to-interpolate-color-along-a-curve-with-specific-colors
- https://www.mathworks.com/matlabcentral/answers/281645-variate-color-depending-on-the-y-value-in-plot
- https://www.mathworks.com/matlabcentral/answers/439176-how-do-i-vary-the-color-along-a-line-in-polar-coordinates
- https://www.mathworks.com/matlabcentral/answers/1849193-creating-rainbow-coloured-plots-in-3d
- https://groups.google.com/g/comp.soft-sys.matlab/c/cLgjSeEC15I?hl=en&pli=1 (a question asked in 1999!)
- ... the list goes on, and on, and on...
User-provided workarounds
- https://undocumentedmatlab.com/articles/plot-line-transparency-and-color-gradient
- https://www.mathworks.com/matlabcentral/fileexchange/19476-colored-line-or-scatter-plot
- https://www.mathworks.com/matlabcentral/fileexchange/23566-3d-colored-line-plot
- https://www.mathworks.com/matlabcentral/fileexchange/30423-conditionally-colored-line-plot
- https://www.mathworks.com/matlabcentral/fileexchange/14677-cline
- https://www.mathworks.com/matlabcentral/fileexchange/8597-plot-3d-color-line
- https://www.mathworks.com/matlabcentral/fileexchange/39972-colormapline-color-changing-2d-or-3d-line
- https://www.mathworks.com/matlabcentral/fileexchange/37725-conditionally-colored-plot-ccplot
- https://www.mathworks.com/matlabcentral/fileexchange/11611-linear-2d-plot-with-rainbow-color
- https://www.mathworks.com/matlabcentral/fileexchange/26692-color_line
- https://www.mathworks.com/matlabcentral/fileexchange/32911-plot3rgb
- And perhaps more?
MathWorks-provided workarounds
- https://www.mathworks.com/videos/coloring-a-line-based-on-height-gradient-or-some-other-value-in-matlab-97128.html
- https://www.mathworks.com/videos/making-a-multi-color-line-in-matlab-97127.html
- https://www.mathworks.com/matlabcentral/fileexchange/95663-color-trajectory-plot (contributed by a MathWorks staff member)
- And perhaps more?
您也可以从以下列表中选择网站:
美洲
- América Latina (Español)
- Canada (English)
- United States (English)
欧洲
- Belgium (English)
- Denmark (English)
- Deutschland (Deutsch)
- España (Español)
- Finland (English)
- France (Français)
- Ireland (English)
- Italia (Italiano)
- Luxembourg (English)
- Netherlands (English)
- Norway (English)
- Österreich (Deutsch)
- Portugal (English)
- Sweden (English)
- Switzerland
- United Kingdom(English)
亚太
- Australia (English)
- India (English)
- New Zealand (English)
- 中国
- 日本Japanese (日本語)
- 한국Korean (한국어)