主要内容
Results for
I found this list on Book Authority about the top MATLAB books: https://bookauthority.org/books/best-matlab-books
My favorite book is Accelerating MATLAB Performance - 1001 tips to speed up MATLAB programs. I always pick something up from the book that helps me out.
A key aspect to masting MATLAB Graphics is getting a hang of the MATLAB Graphics Object Hierarchy which is essentially the structure of MATLAB figures that is used in the rendering pipeline. The base object is the Graphics Root (see groot) which contains the Figure. The Figure contains Axes or other containers such as a Tiled Chart Layout (see tiledlayout). Then these Axes can contain graphics primatives (the objects that contain data and get rendered) such as Lines or Patches.
Every graphics object has two important properties, the "Parent" and "Children" properties which can be used to access other objects in the tree. This can be very useful when trying to customize a pre-built chart (such as adding grid lines to both axes in an eye diagram chart) or when trying to access the axes of a non-current figure via a primative (so "gca" doesn't help out).
One last Tip and Trick with this is that you can declare graphics primatives without putting them on or creating an Axes by setting the first input argument to "gobjects(0)" which is an empty array of placeholder graphics objects. Then, when you have an Axes to plot the primitive on and are ready to render it, you can set the "Parent" of the object to your new Axes.
For Example:
l = line(gobjects(0), 1:10, 1:10);
...
...
...
l.Parent = gca;
Practicing navigating and exploring this tree will help propel your understanding of plotting in MATLAB.
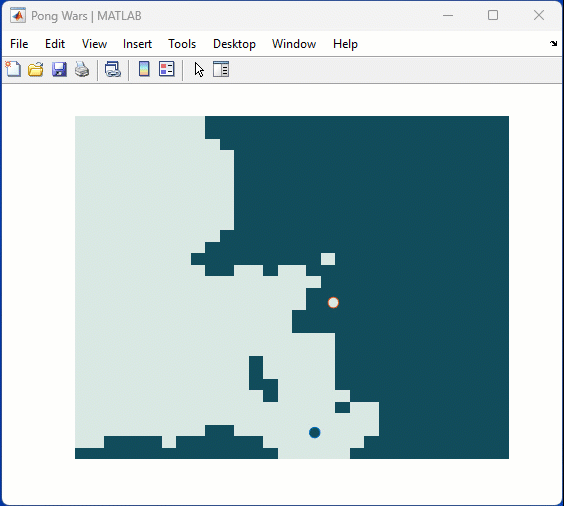
One of my colleauges, Michio, recently posted an implementation of Pong Wars in MATLAB
- Here's the code on GitHub.https://lnkd.in/gZG-AsFX
- If you want to open with MATLAB Online, click here https://lnkd.in/gahrTMW5
- He saw this first here: https://lnkd.in/gu_Z-Pks
Making me wonder about variations. What might the resulting patterns look with differing numbers of balls? Different physics etc?
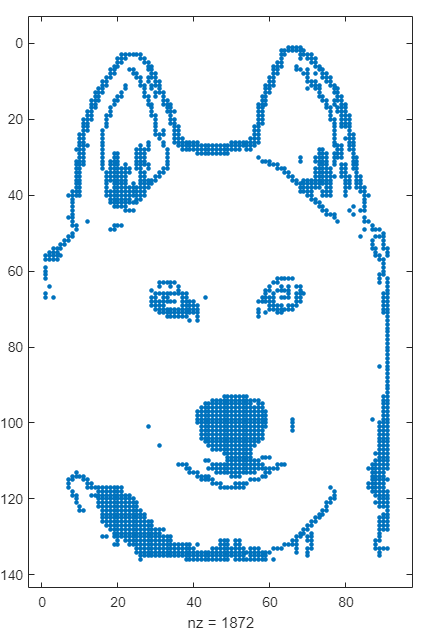
spy
I recently wrote about the new ODE solution framework in MATLAB over the The MATLAB Blog The new solution framework for Ordinary Differential Equations (ODEs) in MATLAB R2023b » The MATLAB Blog - MATLAB & Simulink (mathworks.com)
This was a very popular post at the time - many thousands of views. Clearly everyone cares about ODEs in MATLAB.
This made me wonder. If you could wave a magic wand, what ODE functionality would you have next and why?
Over at Reddit, a MATLAB user asked about when to use a script vs. a live script. How would you answer this?
Starting with MATLAB can be daunting, but the right resources make all the difference. In my experience, the combination of MATLAB Onramp and Cody offers an engaging start.
MATLAB Onramp introduces you to MATLAB's basic features and workflows. Then practice your coding skill on Cody. Challenge yourself to solve 1 basic problem every day for a month! This consistent practice can significantly enhance your proficiency.
What other resources have helped you on your MATLAB journey? Share your recommendations and let's create a comprehensive learning path for beginners!

I'm having problem in its test 6 ... passing 5/6 what would be the real issue..
am wring Transformation matrix correct.. as question said SSW should be 202.5 degree...
so what is the issue..
I would tell myself to understand vectorization. MATLAB is designed for operating on whole arrays and matrices at once. This is often more efficient than using loops.
Is there a reason for TMW not to invest in 3D polyshapes? Is the mathematical complexity of having all the same operations in 3D (union, intersection, subtract,...) prohibitive?
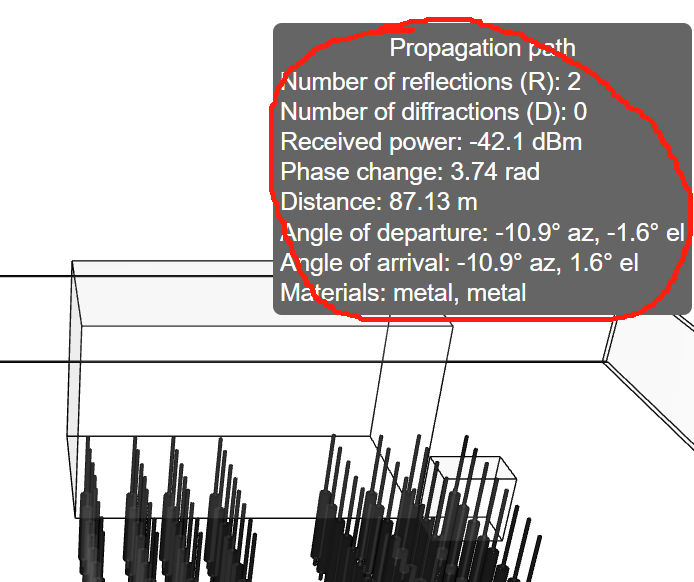
how can I do to get those informations?
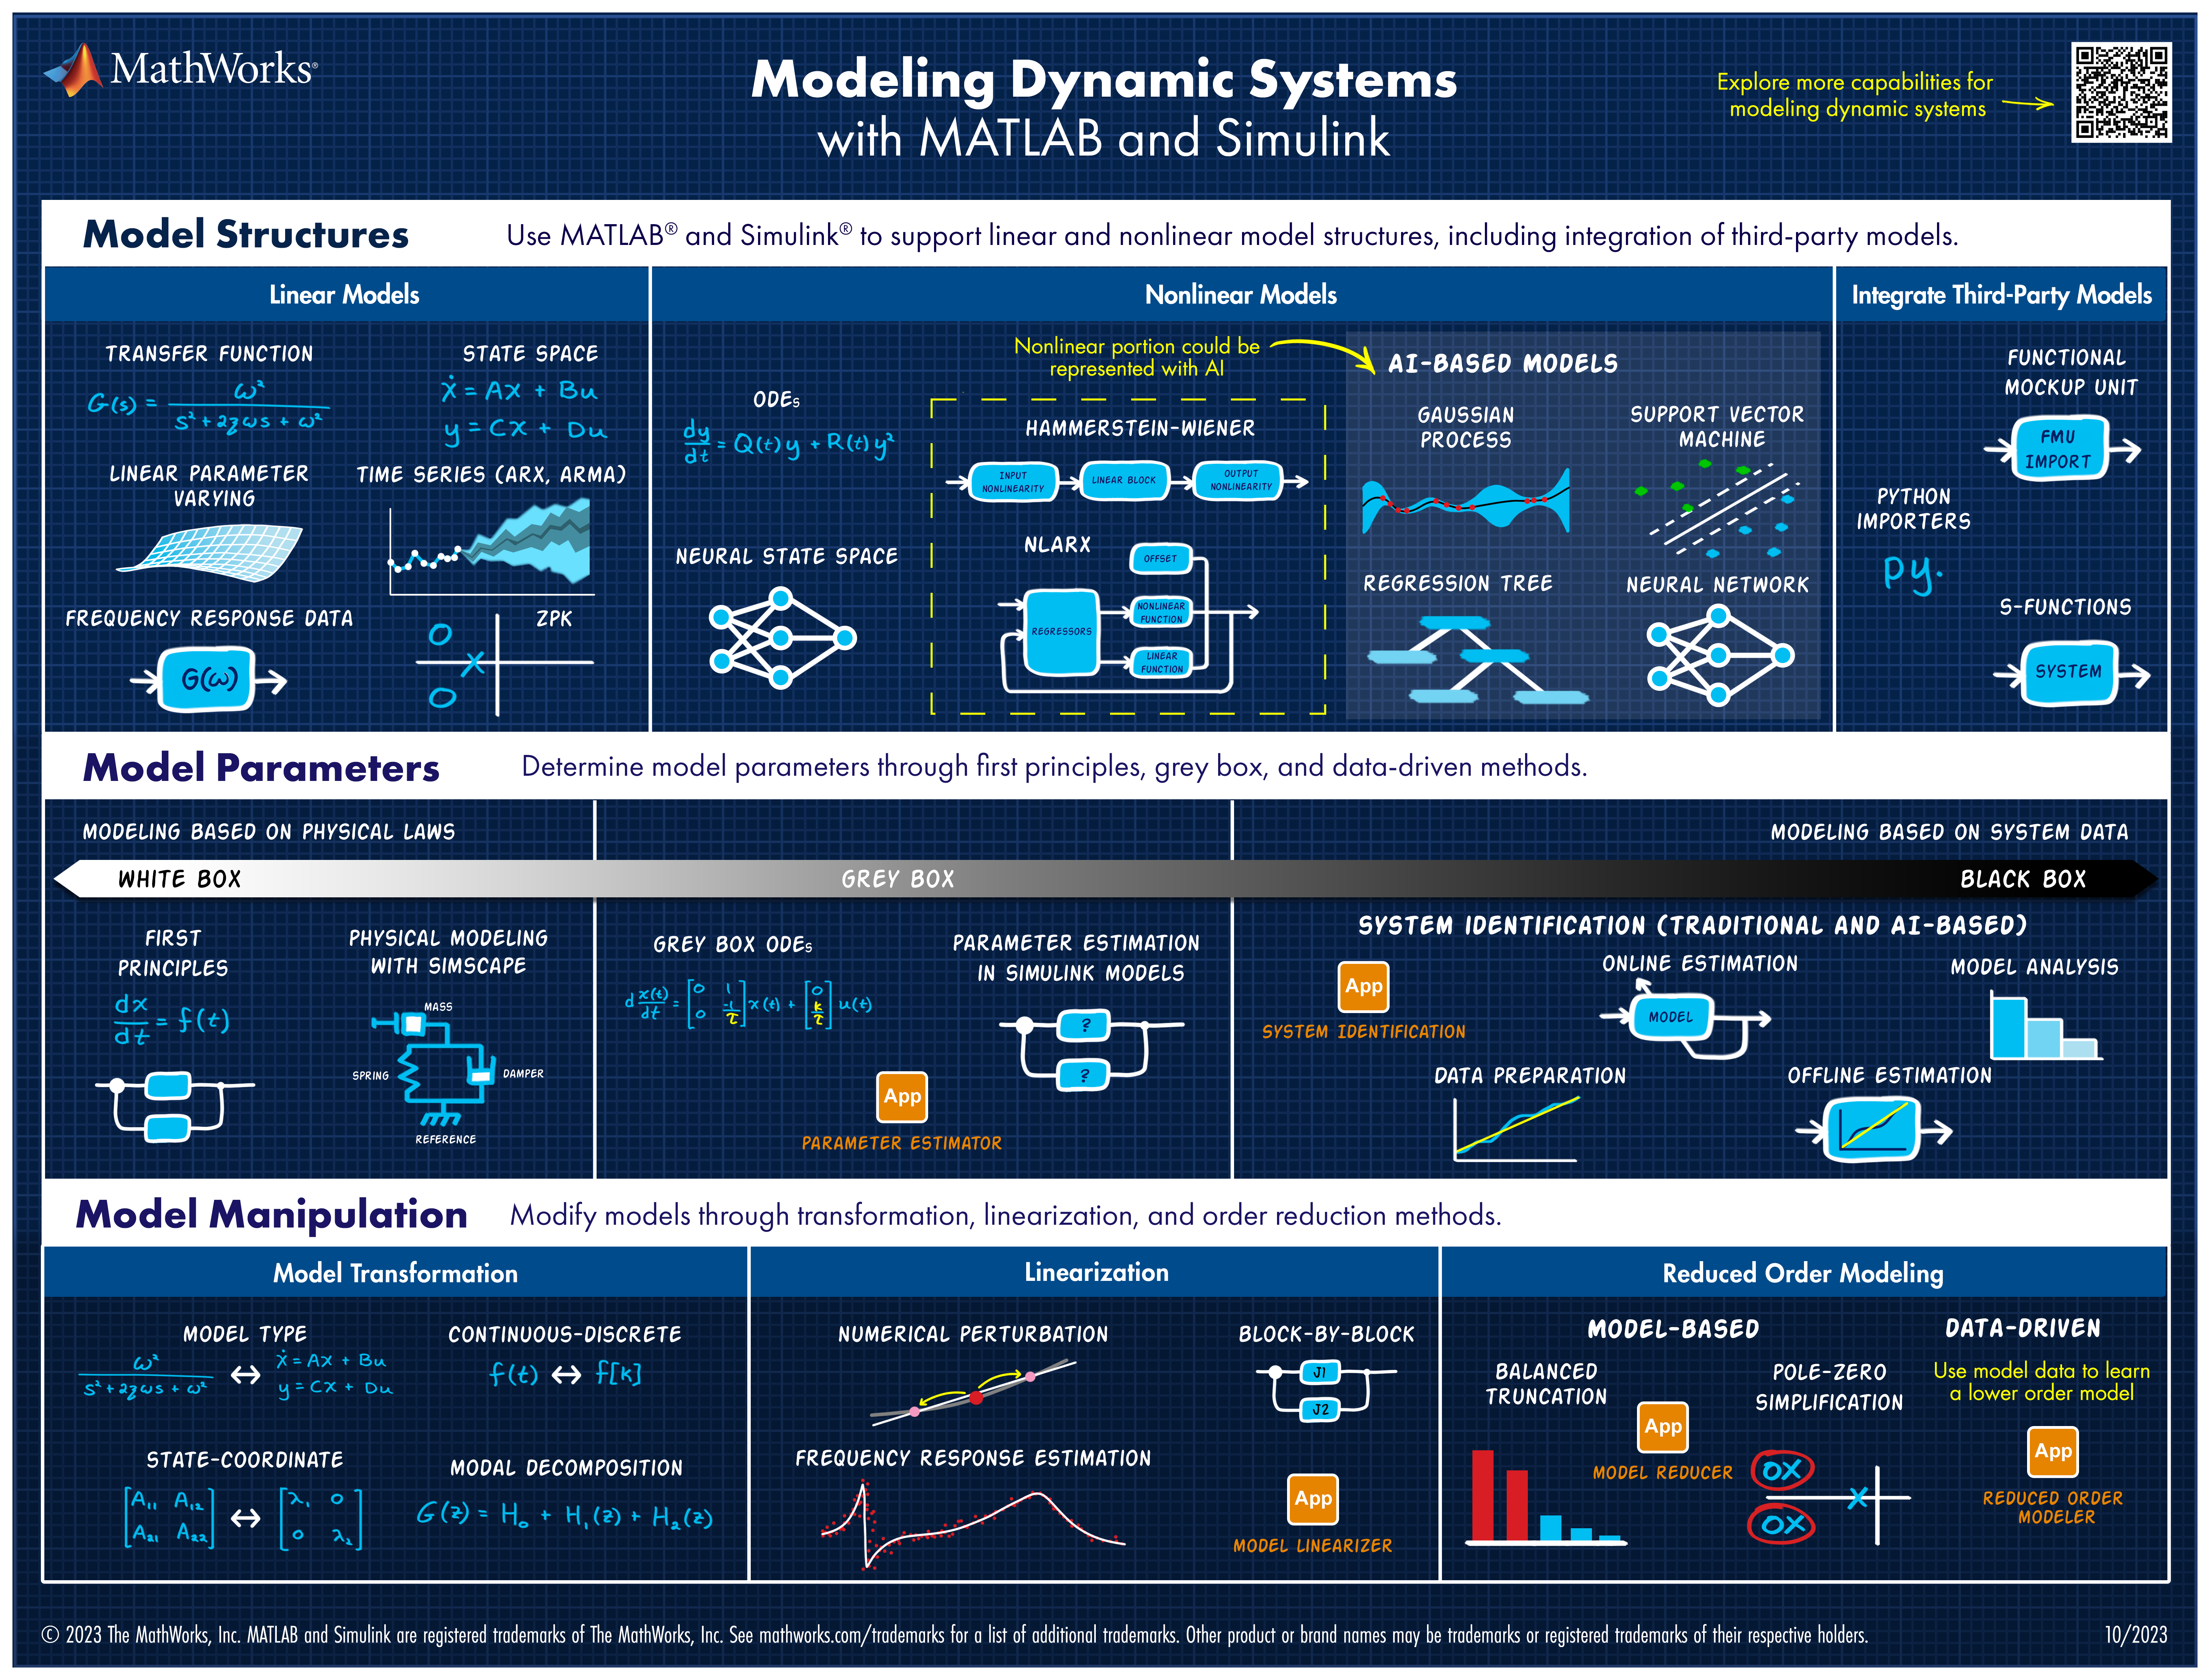
Explore all the capabilities for Modeling Dynamic Systems while keeping them handy with this Cheat Sheet - Download Now.
Quick answer: Add set(hS,'Color',[0 0.4470 0.7410]) to code line 329 (R2023b).
Explanation: Function corrplot uses functions plotmatrix and lsline. In lsline get(hh(k),'Color') is called in for cycle for each line and scatter object in axes. Inside the corrplot it is also called for all axes, which is slow. However, when you first set the color to any given value, internal optimization makes it much faster. I chose [0 0.4470 0.7410], because it is a default color for plotmatrix and corrplot and this setting doesn't change a behavior of corrplot.
Suggestion for a better solution: Add the line of code set(hS,'Color',[0 0.4470 0.7410]) to the function plotmatrix. This will make not only corrplot faster, but also any other possible combinations of plotmatrix and get functions called like this:
h = plotmatrix(A);
% set(h,'Color',[0 0.4470 0.7410])
for k = 1:length(h(:))
get(h(k),'Color');
end
We are thrilled to announce the grand prize winners of our MATLAB Flipbook contest! This year, we invited the MATLAB Graphics Infrastructure team, renowned for their expertise in exporting and animation workflows, to be our judges. After careful consideration, they have selected the top three winners:
Judge comments: Creative and realistic rendering with well-written code
2nd place - Christmas Tree / Zhaoxu Liu
Judge comments: Festive and advanced animation that is appropriate to the current holiday season.
Judge comments: Nice translation of existing shader logic to MATLAB that produces an advanced and appealing visual effect.
In addition, after validating the votes, we are pleased to announce the top 10 participants on the leaderboard:
- Tim
- Zhaoxu Liu / slandarer
- KARUPPASAMYPANDIYAN M
- Dhimas Mahardika S.Si., M.Mat
- Augusto Mazzei
- Jenny Bosten
- Lucas
- Jr
- Victoria
- ME
Congratulations to all! Your creativity and skills have inspired many of us to explore and learn new skills, and make this contest a big success!
The MATLAB Flipbook Mini Hack contest has concluded! During the 4 weeks, over 600 creative animations have been created. We had a lot of fun and a great learning experience! Thank you, everyone!
Now it’s the time to announce week 4 winners. Note that grand prize winners will be announced shortly after we validate votes on winning entries.
Realism:
Holiday & Season:
Abstract:
Cartoon:
Congratulations, weekly winners!We will reach out to you shortly for your prizes.
Looking for an opportunity to practice your AI skills on a real-world problem? Interested in AI for climage change? Sign up for the Kelp Wanted challenge, which tasks participants with developing an algorithm that can detect the presence of kelp forests from satellite images.
Participants of all skill levels from anywhere in the world are welcome to compete!
MathWorks provides the following resources for all participants:
Have you marveled at the breathtaking, natural-looking animations crafted by the creative minds in the Flipbook Mini Hack contest? Think of @Tim, @Jenny Bosten, and @Zhaoxu Liu / slandarer- their work is nothing short of extraordinary.
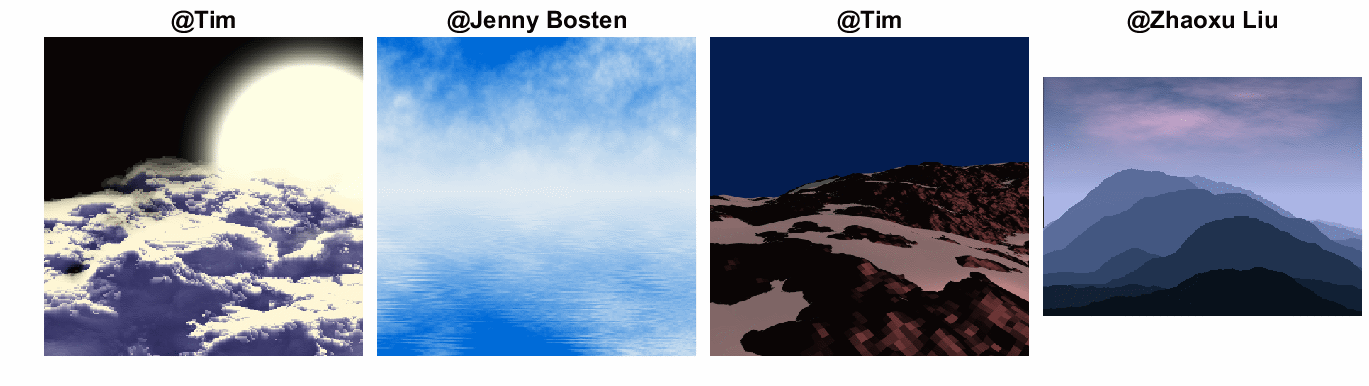
So, what's their secret? Adam Danz, a developer in the MATLAB Graphics and Charting team and a top community contributor, has graciously unveiled the mysteries in his latest blog post - "Creating natural textures with power-law noise: clouds, terrains, and more." The post offers simple, step-by-step instructions and code snippets, empowering you to grasp these enchanting techniques effortlessly.
Check it out and we hope it sparks your creativity and serves as a wellspring of inspiration. With only 3 days remaining before the contest draws to a close, it's time to dive into the code and let your imagination soar!
In Week 3, we reached the 400-animations milestone! Let’s work together to achieve the 500-animations goal!
During the last week of the contest, we strongly encourage you to inspire your colleagues, classmates, or friends to vote. Voters will also have the opportunity to win a MATLAB T-shirt.
Mini Hack Winners - Week 3
Math, Physics, or Science explanation:
Most creative remix:
40:
Math is beautiful:
Mashup (Combined themes):
Nature:
Holidays:
Congratulations, winners!
In week 4, we’d love to see more entries in the following categories:
- Holidays:
- Seasons:
- Abstract:
- Mashup (mixed categories)
A gentle reminder that you have a direct impact on the next generation of animation tools in MATLAB! Don’t forget to share your thoughts and ideas with us.
i've finished writing the code for my ~masterpiece~ and it doesn't run on the contest new entry page. it runs on matlab on my desktop and in the matlab live editor in my browser, but not where i really need it to. usually it'll draw the first frame the first time i run the code in a new window, but not any subsequent times. whether i hit "run" or "create animation", the screen grays out as it's supposed to, but then returns to normal without generating the first frame or animation.
i'm not getting a timeout warning or any error messages. i timed the code on my laptop and it takes about 100ish seconds to run and generate the animation the first time i run it before clearing everything from my workspace (and then it takes about twice as long each subsequent time, which makes me a bit nervous. can't figure out why this is the case at all!), which is well within the 255 second limit for the contest. as far as i know, the most computationally expensive function i'm using is patch(). i'm pretty close to the character limit, but i don't know if that's part of the problem.
i tried vectorizing some of the code instead of using for loops, which made the code run slightly slower. i tried using a nested function instead of using drawframe() and an auxiliary function, but that didn't help. i tried clearing all variables except f at the end of drawframe() to no avail. i tried using the close command at the start of drawframe(), with similar success. i updated chrome, closed a bunch of windows, tried safari, used my sister's laptop, all with no luck.
has anyone else had this or a similar problem? any advice?
thanks!
您也可以从以下列表中选择网站:
美洲
- América Latina (Español)
- Canada (English)
- United States (English)
欧洲
- Belgium (English)
- Denmark (English)
- Deutschland (Deutsch)
- España (Español)
- Finland (English)
- France (Français)
- Ireland (English)
- Italia (Italiano)
- Luxembourg (English)
- Netherlands (English)
- Norway (English)
- Österreich (Deutsch)
- Portugal (English)
- Sweden (English)
- Switzerland
- United Kingdom(English)
亚太
- Australia (English)
- India (English)
- New Zealand (English)
- 中国
- 日本Japanese (日本語)
- 한국Korean (한국어)