搜索
In a discussion on LInkedin about my recent blog post, Do these 3 things to increase the reach of your open source MATLAB toolbox, I was asked by "Could you elaborate on why someone might consider opening/sharing their code? Thinking of early-career researchers, what might be in it for them?"
I'll give my answer here but I'm more interested in yours. How would you have answered this?
This is what I said:
- It's the right thing to do scientifically. A computational paper is essentially just an advertisement of what you've done. The code contains vital details about how you actually did it. A computational paper is incomplete without the code.
- If you only describe your algorithm in a paper, I have to implement it before I can apply your research to my problem. If you share the code, I can get started much more quickly using your research. This means I publish faster and since I am a good scientist, this means you get cited faster.
- Other scientists start off as users of your code. This leads to citations. Over time, some of them start deeply using and modifying your code, this leads to collaborators.
- Once you decide to share code via something like GitHub, you quickly start adopting good software engineering practices without initially realizing it. This improves the quality of your research since adopting good software practices makes it more likely that your software will give the right answers.
That last point can be a little hard to get your head around sometimes. Even if all you do is use file upload to get your stuff onto GitHub (i.e. you're not using git properly yet) you will start to naturally converge towards better code.
Why? Because as soon as you share code, you have to solve the problem of getting it to run on someone else's machine.
A trivial example concerns hard coded paths, for example. If you only ever run it on your machine then having a line like datafile = "C:\Mystuff\data.csv" always works but it breaks as soon as I try to run it on my machine. You'll look at this and think "Maybe there's a better way to do that".
Similarly dependencies. Your Path may be full of stuff that isn't present on my machine. As soon as I try to run your code, it won't work and you'll have to figure out how to handle dependencies in a reproducible way.
Documentation! An empty README.md is no good if you expect me to know how to use your code. You at least have to say something like "To run this, type runme(N) into MATLAB where N is the size of the model...etc etc)
The act of sharing, and dealing with the consequences, leads to much better code than if you keep it to yourself.
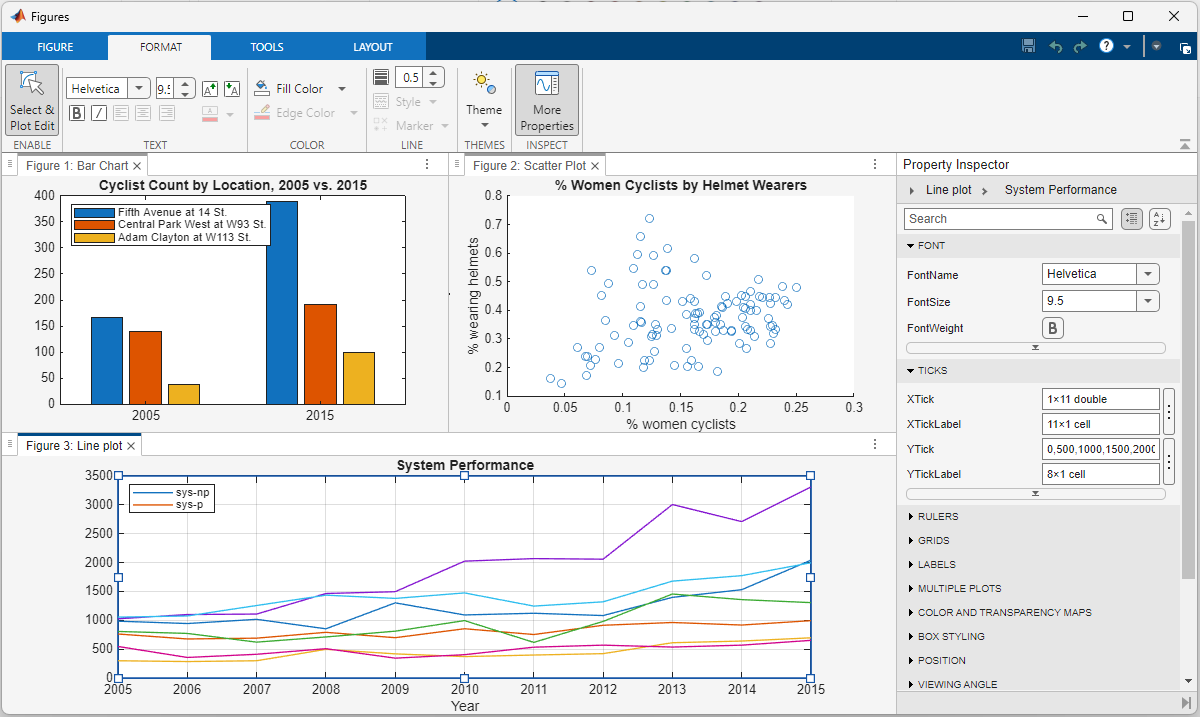
The MATLAB R2025a release gave figures a makeover. @Brian Knolhoff, a developer on the Figure Infrastructure and Services team, reviews the new Figure Container in the Graphics and App Building blog.
Learn the four ways to tile figures, what docking means, and other new features.
I am deeply honored to announce the official publication of my latest academic volume:
MATLAB for Civil Engineers: From Basics to Advanced Applications
(Springer Nature, 2025).
This work serves as a comprehensive bridge between theoretical civil engineering principles and their practical implementation through MATLAB—a platform essential to the future of computational design, simulation, and optimization in our field.
Structured to serve both academic audiences and practicing engineers, this book progresses from foundational MATLAB programming concepts to highly specialized applications in structural analysis, geotechnical engineering, hydraulic modeling, and finite element methods. Whether you are a student building analytical fluency or a professional seeking computational precision, this volume offers an indispensable resource for mastering MATLAB's full potential in civil engineering contexts.
With rigorously structured examples, case studies, and research-aligned methods, MATLAB for Civil Engineers reflects the convergence of engineering logic with algorithmic innovation—equipping readers to address contemporary challenges with clarity, accuracy, and foresight.
📖 Ideal for:
— Graduate and postgraduate civil engineering students
— University instructors and lecturers seeking a structured teaching companion
— Professionals aiming to integrate MATLAB into complex real-world projects
If you are passionate about engineering resilience, data-informed design, or computational modeling, I invite you to explore the work and share it with your network.
🧠 Let us advance the discipline together through precision, programming, and purpose.

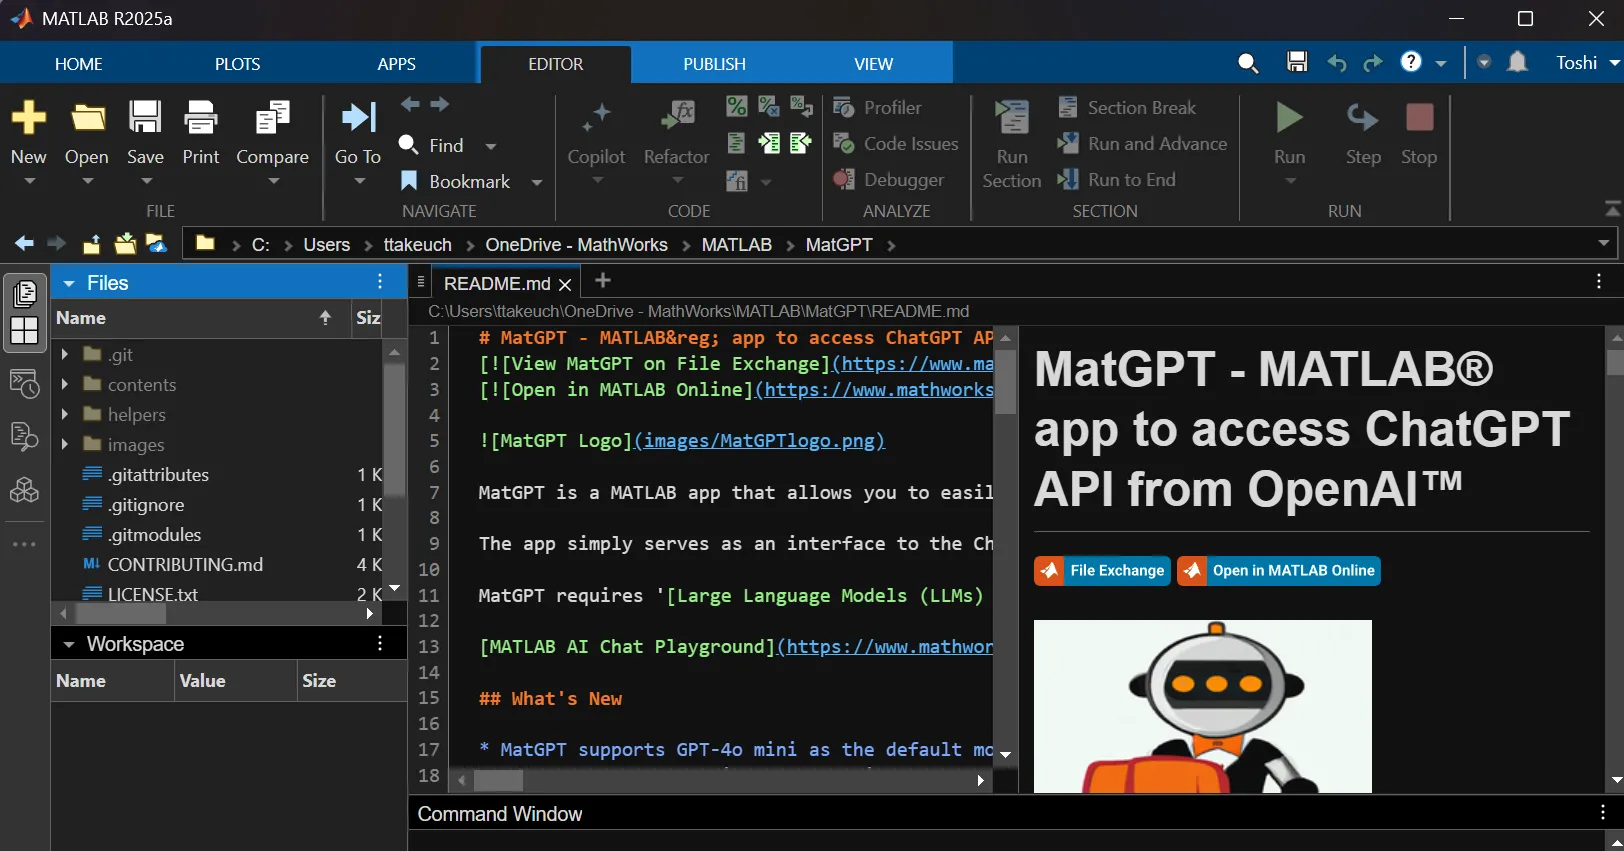
In case you missed it in my overview of the MATLAB R2025a release, Markdown support has been greatly improved. This picture says it all
The following lines were added to the subplot function in version 2025a (line 291):
if ancestorFigure.Units == "normalized"
waitfor(ancestorFigure,'FigureViewReady',true);
end
That code isn't in version 2024a.
Because of this, I'm experiencing issues that cause the code to stop running when using subplot in this way:
figure('Units','normalized','Position',[0 0 0.3 0.3])
subplot(1,2,1)
...
Has anyone else encountered this error?
Does anyone understand the need for those lines of code?
As far as I can tell, there is still no official support for creating publication-ready tables from regression output, either as latex or natively. Although MATLAB isn't primarily statistical software, this still seems like an oversight, as almost any similar software has this capability built-in or as a package.
Due to MATLAB being banned in some mainland Chinese universities in 2020, in recent years a Chinese company called "Suzhou Tongyuan SoftControl" has completely imitated MATLAB’s behavior. Below are some screenshots as evidence. What is your opinion on this issue?
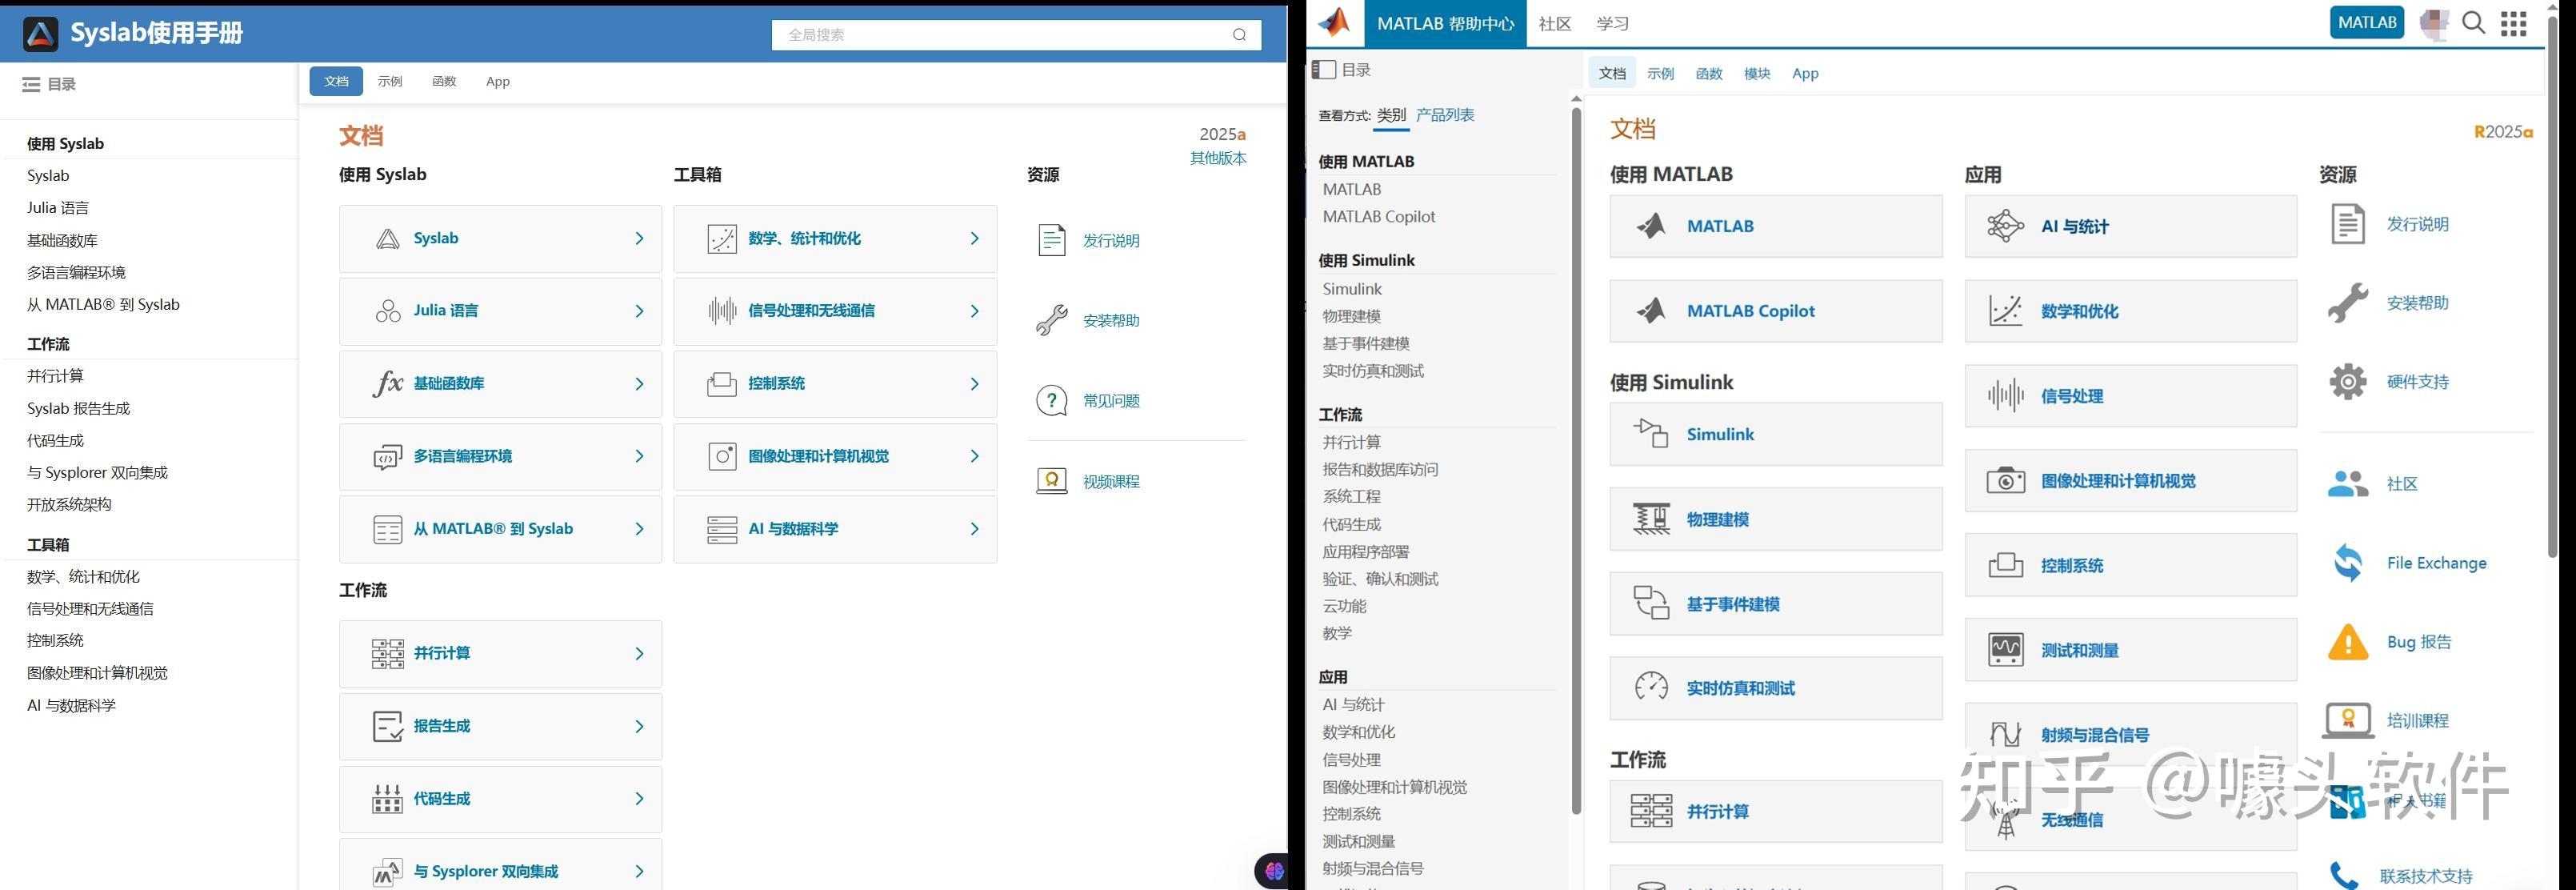
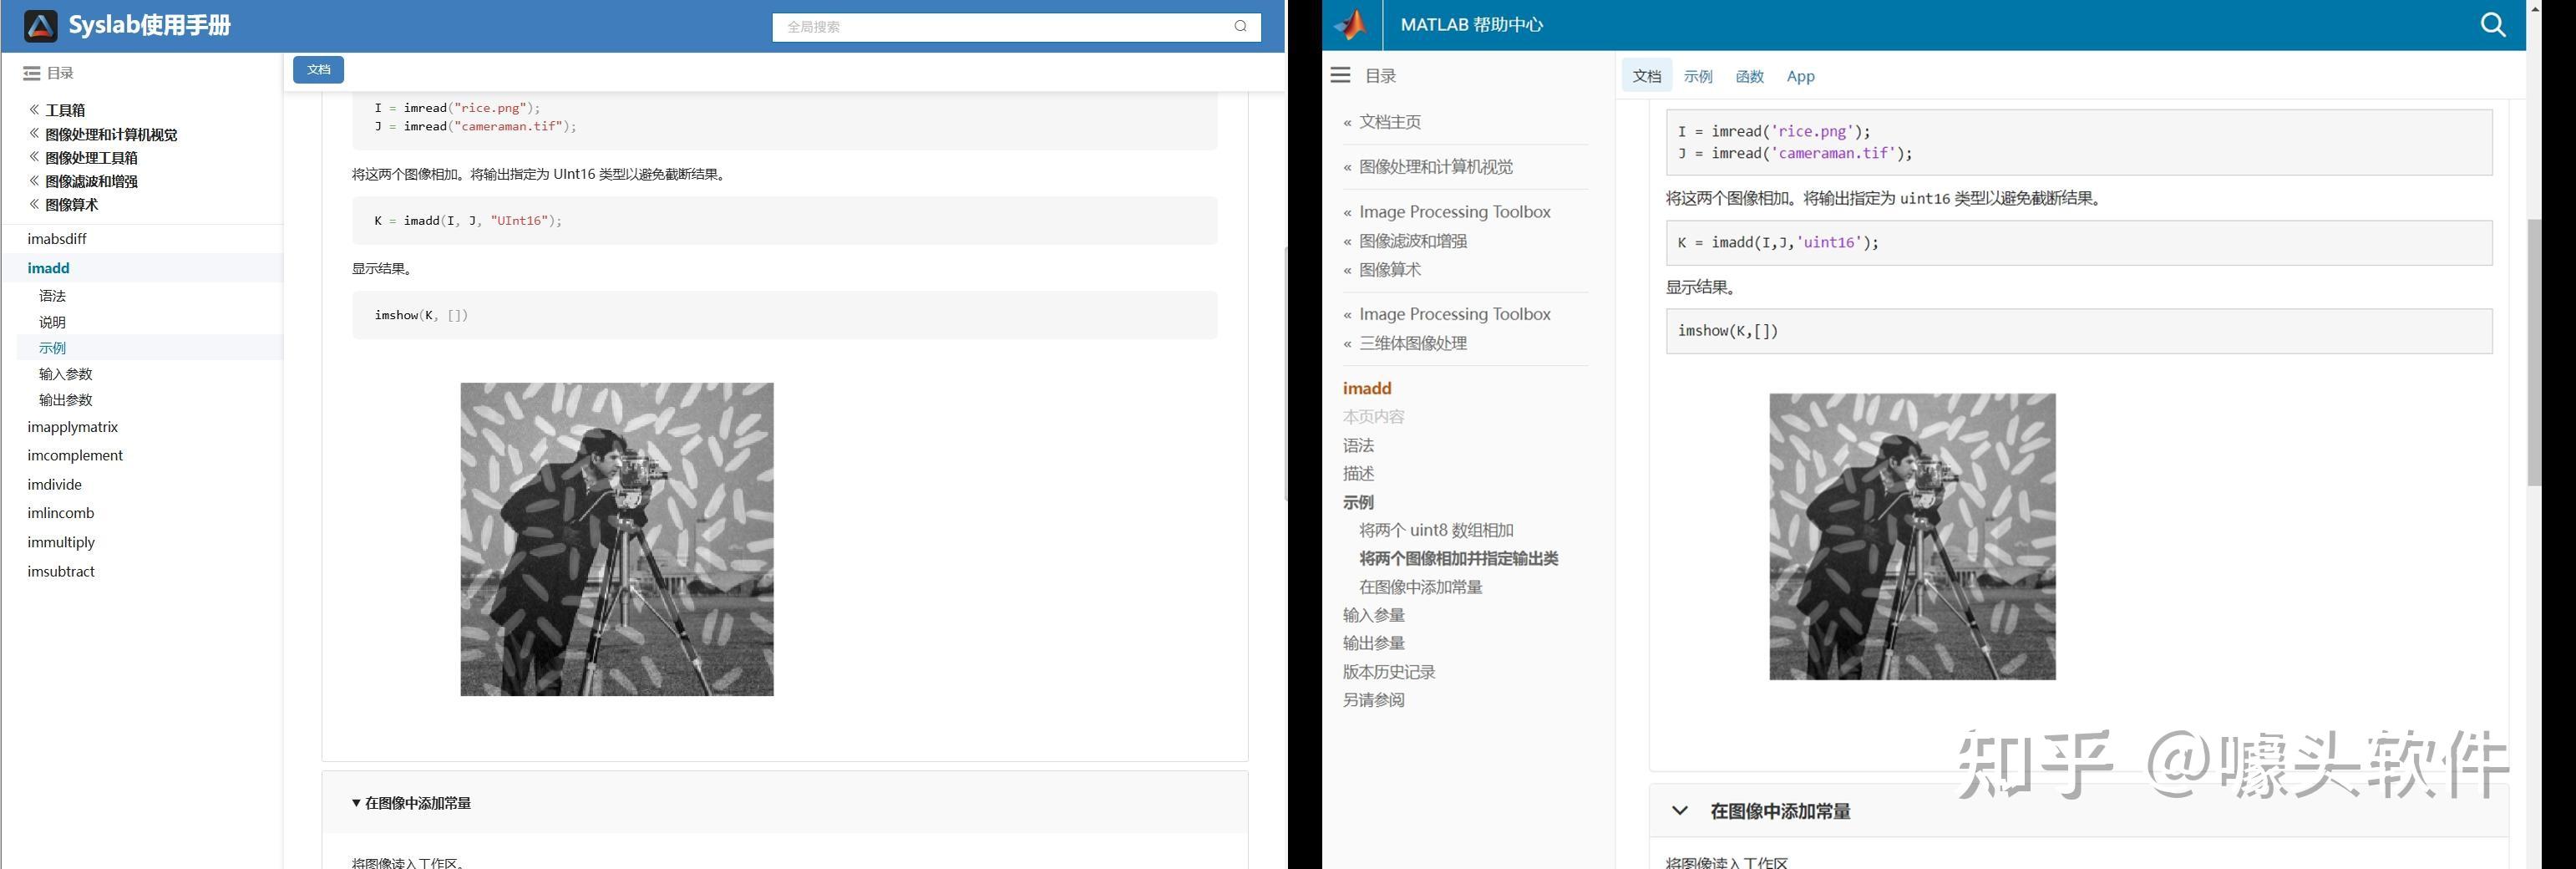
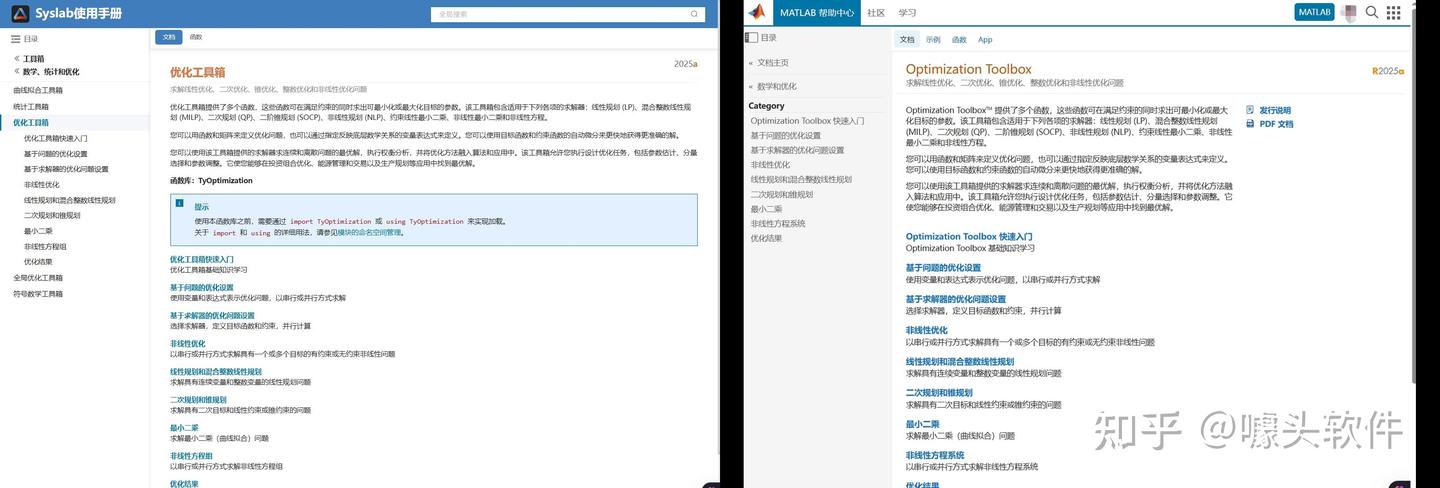
Source: Syslab 帮助文档-苏州同元软控
After waiting for a long time, the MathWorks official Community has finally resumed some of its functionalitys! Congratulations! Next, I’d like to share some thoughts to help prevent such outages from happening again, as they have affected far too many people.
- Almost all resources rely solely on MathWorks servers. Once a failure (or a ransomware attack) occurs, everything is paralyzed, and there isn’t even a temporary backup server? For a big company like MathWorks to have no contingency plan at all is eye-opening. This tells us that we should have our own temporary emergency servers!
- The impact should be minimized. For example, many users need to connect to the official servers to download various support packages, such as the “Deep Learning Toolbox Converter for ONNX Model Format.” Could these be backed up and mirrored to the “releases” section of a GitHub repository, so users in need can download them.
- A large proportion of users who have already installed MATLAB cannot access the online help documentation. Since R2023a, installing the help documentation locally has become optional. This only increases the burden on the servers? Moreover, the official website only hosts documentation for the past five years. That means after 2028, if I haven’t installed the local offline documentation, I won’t be able to access the online documentation for R2023a anymore?
Anything else you’d like to add? Feel free to leave a comment.
Any status updates on the license center and add on tool boxes?
@William Rose, Your dedication to helping others and sharing your knowledge is a big win for the community. Thanks for taking the time to contribute so thoughtfully - your impact is definitely being noticed.👏
Keep it up!
The attached code is an animated solution of the three body problem. On 2024b it runs perfectly fine. When we tried it on 2025a, the animation constantly hitches, the CPU usage is almost double and the runtime is much slower. The curves also look less detailed and jagged in some places. When we run it without drawing anything, the performance seems comparable between versions, but still slightly slower. All of this behavior persists across different hardware. Anybody else having this kind of problem with the new release? I'm suspecting the graphics backend changes may be the culprit here...
clc
clear
close
syms t x1(t) y1(t) x2(t) y2(t) x3(t) y3(t)
G = 6.6743 * 10^-11;
%epsilon = 1e-4
m1 = 10^12;
m2 = 1*10^12;
m3 = 1*10^12;
r1 = [x1(t),y1(t)];
K1 = 1/2 * m1 * (diff(x1(t),t)^2 + diff(y1(t),t)^2);
r2 = [x2(t),y2(t)];
K2 = 1/2 * m2 * (diff(x2(t),t)^2 + diff(y2(t),t)^2);
r3 = [x3(t),y3(t)];
K3 = 1/2 * m3 * (diff(x3(t),t)^2 + diff(y3(t),t)^2);
L1x = diff(diff(K1,diff(x1(t),t)) , t);
L1y = diff(diff(K1,diff(y1(t),t)) , t);
L2x = diff(diff(K2,diff(x2(t),t)) , t);
L2y = diff(diff(K2,diff(y2(t),t)) , t);
L3x = diff(diff(K3,diff(x3(t),t)) , t);
L3y = diff(diff(K3,diff(y3(t),t)) , t);
r12 = r2 - r1;
r13 = r3 - r1;
r23 = r3 - r2;
dlugosc_r12 = sqrt(r12(1)^2 + r12(2)^2);
dlugosc_r13 = sqrt(r13(1)^2 + r13(2)^2);
dlugosc_r23 = sqrt(r23(1)^2 + r23(2)^2);
Q12 = G * m1 * m2 / dlugosc_r12^2 * (r2-r1)/dlugosc_r12;
Q13 = G * m1 * m3 / dlugosc_r13^2 * (r3-r1)/dlugosc_r13;
Q23 = G * m2 * m3 / dlugosc_r23^2 * (r3-r2)/dlugosc_r23;
Q21 = -Q12;
Q32 = -Q23;
Q31 = -Q13;
Q1 = Q12 + Q13;
Q2 = Q21 + Q23;
Q3 = Q31 + Q32;
eqn_1_x = L1x == Q1(1);
eqn_1_y = L1y == Q1(2);
eqn_2_x = L2x == Q2(1);
eqn_2_y = L2y == Q2(2);
eqn_3_x = L3x == Q3(1);
eqn_3_y = L3y == Q3(2);
syms X1 Y1 X2 Y2 X3 Y3
Q1_num = subs(Q1,[x1(t), y1(t), x2(t), y2(t), x3(t), y3(t)],[X1, Y1, X2, Y2, X3, Y3]);
Q2_num = subs(Q2,[x1(t), y1(t), x2(t), y2(t), x3(t), y3(t)],[X1, Y1, X2, Y2, X3, Y3]);
Q3_num = subs(Q3,[x1(t), y1(t), x2(t), y2(t), x3(t), y3(t)],[X1, Y1, X2, Y2, X3, Y3]);
syms vx1 vy1 vx2 vy2 vx3 vy3
state_dot = [
vx1;
vy1;
vx2;
vy2;
vx3;
vy3;
Q1_num(1)/m1;
Q1_num(2)/m1;
Q2_num(1)/m2;
Q2_num(2)/m2;
Q3_num(1)/m3;
Q3_num(2)/m3
];
f = matlabFunction(state_dot, 'Vars', {sym('t'), [X1; Y1; X2; Y2; X3; Y3; vx1; vy1; vx2; vy2; vx3; vy3]});
u0 = [-1e5; %x1
0; %y1
1e5; %x2
0; %y2
0; %x3
sqrt(3)*1e5; %y3
-11/2 * 1e-3; %vx1
11/2*sqrt(3)*1e-3; %vy1
-11/2 * 1e-3; %vx2
-11/2*sqrt(3)*1e-3; %vy2
11e-3; %vx3
0]; %vy3
tspan = [0, 1e9];
%options = odeset('RelTol', 1e-15, 'AbsTol', 1e-20);
[t_sol, u_sol] = ode45(f, tspan, u0);
t_anim = linspace(t_sol(1), t_sol(end), 5000);
u_anim = interp1(t_sol, u_sol, t_anim);
%%
% figure;
tor_1 = plot(u_anim(:,1), u_anim(:,2), 'r', 'LineWidth',1.5); hold on;
tor_2 = plot(u_anim(:,3), u_anim(:,4), 'g', 'LineWidth',1.5);
tor_3 = plot(u_anim(:,5), u_anim(:,6), 'b', 'LineWidth',1.5);
% xlabel('x [m]');
% ylabel('y [m]');
% legend('Ciało 1', 'Ciało 2', 'Ciało 3');
% title('Trajektorie ciał w układzie trzech ciał');
% axis equal
% grid on;
pozycja_1 = plot(u_anim(1,1),u_anim(1,2),'ro','markersize',10,'markerface','r'); hold on
pozycja_2 = plot(u_anim(1,3),u_anim(1,4),'go','markersize',10,'markerface','g');
pozycja_3 = plot(u_anim(1,5),u_anim(1,6),'bo','markersize',10,'markerface','b');
% xlim([-2e5,2e5])
% ylim([-2e5,2e5])
axis equal
for i = 1 : 1 : length(t_sol)
set(pozycja_1,'XData', u_anim(i,1),'YData', u_anim(i,2));
set(pozycja_2,'XData', u_anim(i,3),'YData', u_anim(i,4));
set(pozycja_3,'XData', u_anim(i,5),'YData', u_anim(i,6));
set(tor_1,'XData', u_anim(1:i,1),'YData', u_anim(1:i,2));
set(tor_2,'XData', u_anim(1:i,3),'YData', u_anim(1:i,4));
set(tor_3,'XData', u_anim(1:i,5),'YData', u_anim(1:i,6));
drawnow;
% pause(0.001);
end
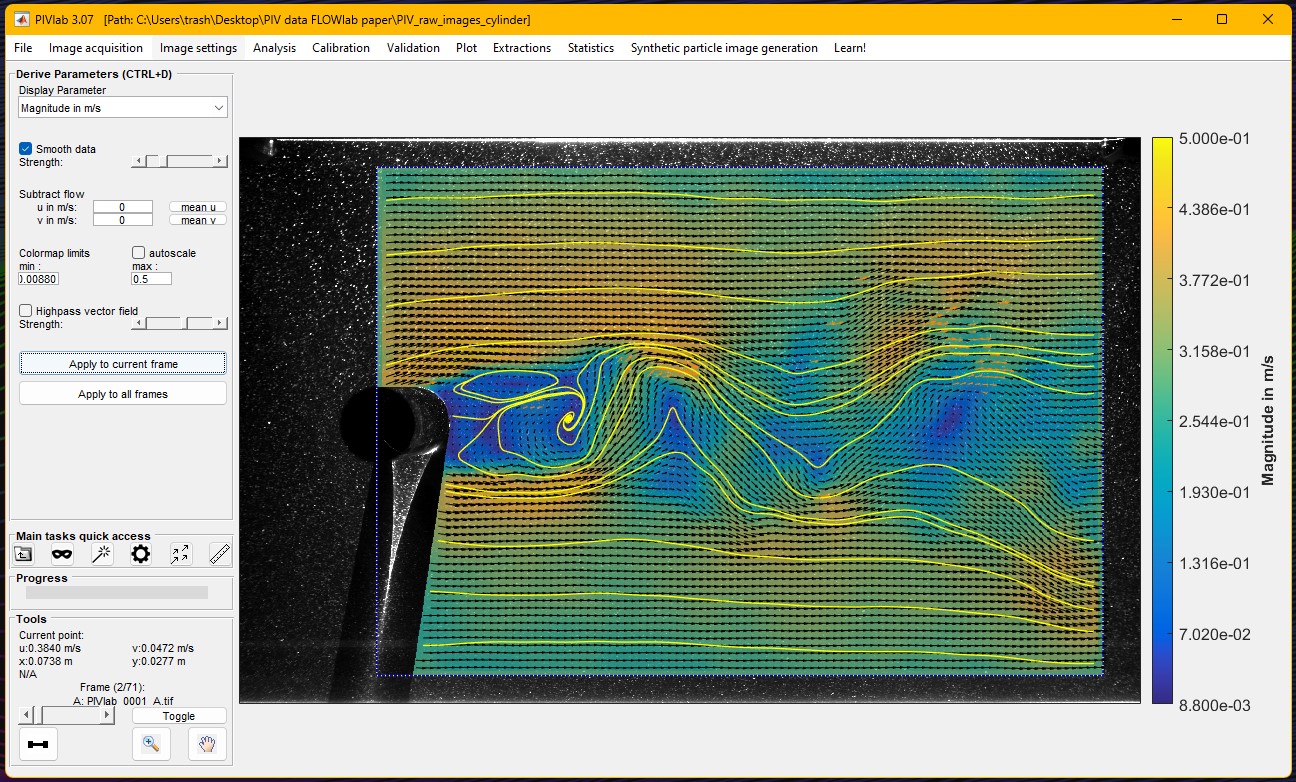
During the past twelve months, PIVlab, a MATLAB Community Toolbox for particle interference velocimetry (a technique for fluid flow measurement) set a new record for all-time File Exchange downloads, surpassing one hundred thousand, dating back to 2010. It also recently eclipsed the 1000 downloads/month mark on File Exchange.
Congratulations to @William Thielicke and his team for this fantastic long term achievement and head over to the File Exchange to download and use it: PIVlab - particle image velocimetry (PIV) tool with GUI - File Exchange - MATLAB Central
I like this problem by James and have solved it in several ways. A solution by Natalie impressed me and introduced me to a new function conv2. However, it occured to me that the numerous test for the problem only cover cases of square matrices. My original solutions, and Natalie's, did niot work on rectangular matrices. I have now produced a solution which works on rectangular matrices. Thanks for this thought provoking problem James.
Why is RoBERTa not available as a pretrained model? It is superior to BERT in many fields and has become more popular in the literature. For faster inference, you should offer DistilBERT, which is more modern than BERT but smaller/faster. The respository hasn't been updated in two years, which is a lifetime in the field of deep learning.
https://github.com/matlab-deep-learning/transformer-models
Large Languge model with MATLAB, a free add-on that lets you access LLMs from OpenAI, Azure, amd Ollama (to use local models) on MATLAB, has been updated to support OpenAI GPT-4.1, GPT-4.1 mini, and GPT-4.1 nano.
According to OpenAI, "These models outperform GPT‑4o and GPT‑4o mini across the board, with major gains in coding and instruction following. They also have larger context windows—supporting up to 1 million tokens of context—and are able to better use that context with improved long-context comprehension."
What would you build with the latest update?

Hi,
We are looking for users of Simulink who also work with the Vehicle Network toolbox to attend a usability session. This wil be a 2 hour session and will offer $100 compensation.
If you are interested, please answer the questions below and send them to: usabilityrecruiting@mathworks.com
In the past 2 years, how often have you worked with ARXML (AUTOSAR XML) files in vehicle network communication?
a. At least 3-5 days per week
b. Once or twice a week
c. A few times a month
d. Once a month or less
e. Never
-
3. Have you worked with automotive ethernet in the past?
a. Yes
b. No
-
4. Which of the following best describe your experience with Simulink? (select all that apply)
Study Screener Q4
a. I have used CAN/ CAN FD blocks (https://www.mathworks.com/help/vnt/can-simulink-communication.html)
b. I have used Simulink Buses
c. I have used Simulink Data Dictionaries
d. Other
-
Thank you!
Elaine
If you are interested in this session, just send an email with the answers to the following questions to usabilityrecruiting@mathworks.com
1. Which of the following best describes your experience with Design of Experiment (DOE)?
a. I regularly use DOE in my work and am comfortable designing experiments and analyzing results
b. I have used DOE in a few projects and understand its principles and applications
c. I have a basic understanding of DOE concepts but have limited practical experience
d. I have never used DOE but I’m interested in learning
-
2. Briefly describe one of your recent projects where you used/want to use DOE. What are the objectives and outcomes?
-
Thank you!
This website is not very attractive or easy to navigate. It is difficult to even find this section - if you start at the Mathworks website, there is no community tab:

You have to go to Help Center, which takes you to documentation, and then click on Community (redirecting you from https://www.mathworks.com/help to https://www.mathworks.com/matlabcentral)
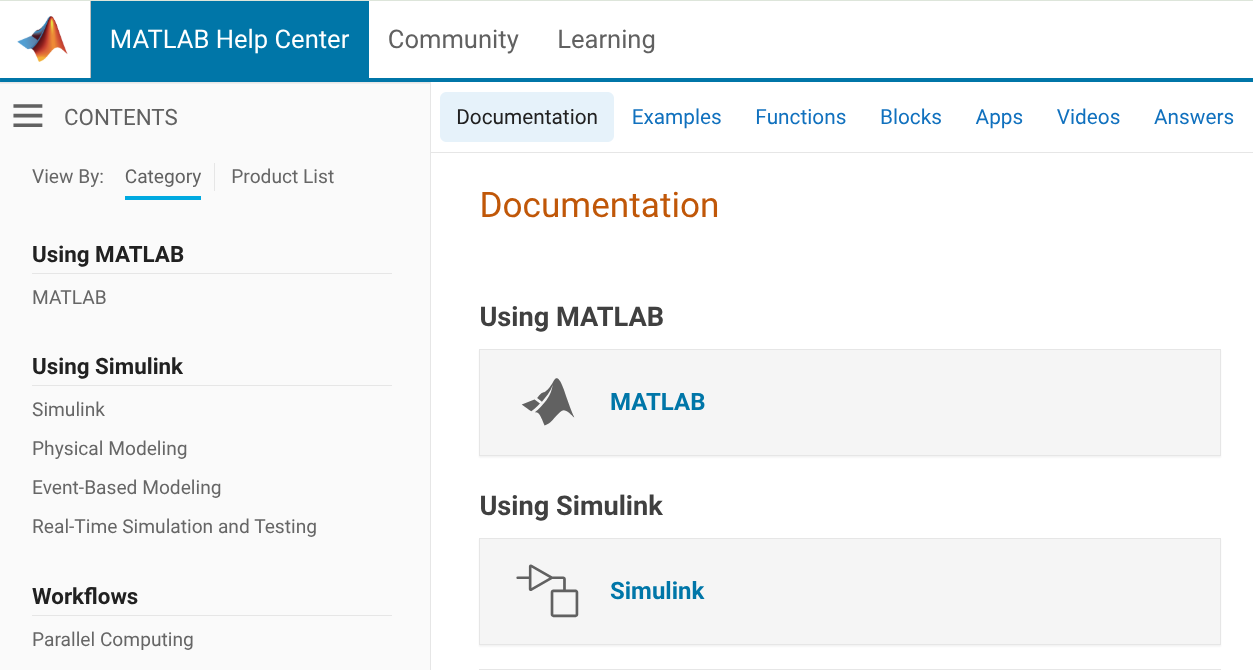
Once you get there it's still a mess
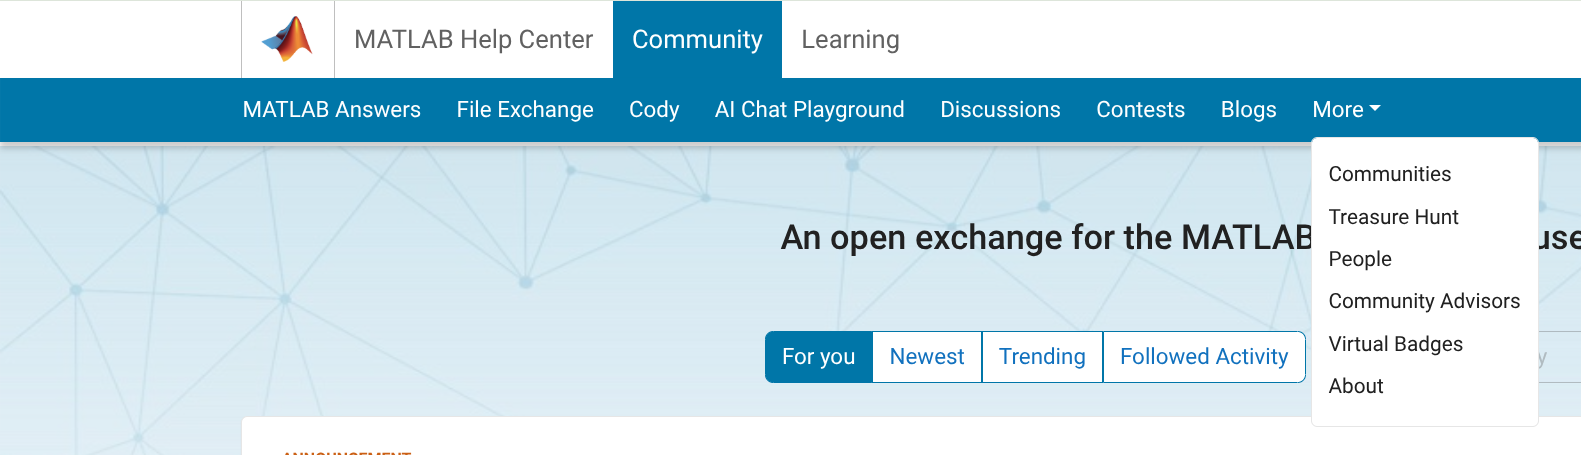
If I have a question, it's not clear whether I should go to MATLAB Answers, Discussions, or Communities. It's not clear what the People page is for, or why it's split off from Community Advisors and Virtual Badges. "Cody" isn't very self-explanatory, and people will only stumble on it by accident, this seems like it should be integrated with contests. Don't get me started on the mess of a Blogs page. My browser knows that I speak English, so why am I being served Japanese language blogs?
I know that web design isn't the main priority of Mathworks, but the website has a very early-2010's look that increasingly feels dated. I hope there will be more consideration given to web UI/UX in the future.