主要内容
Results for
What's the weather like in your place?
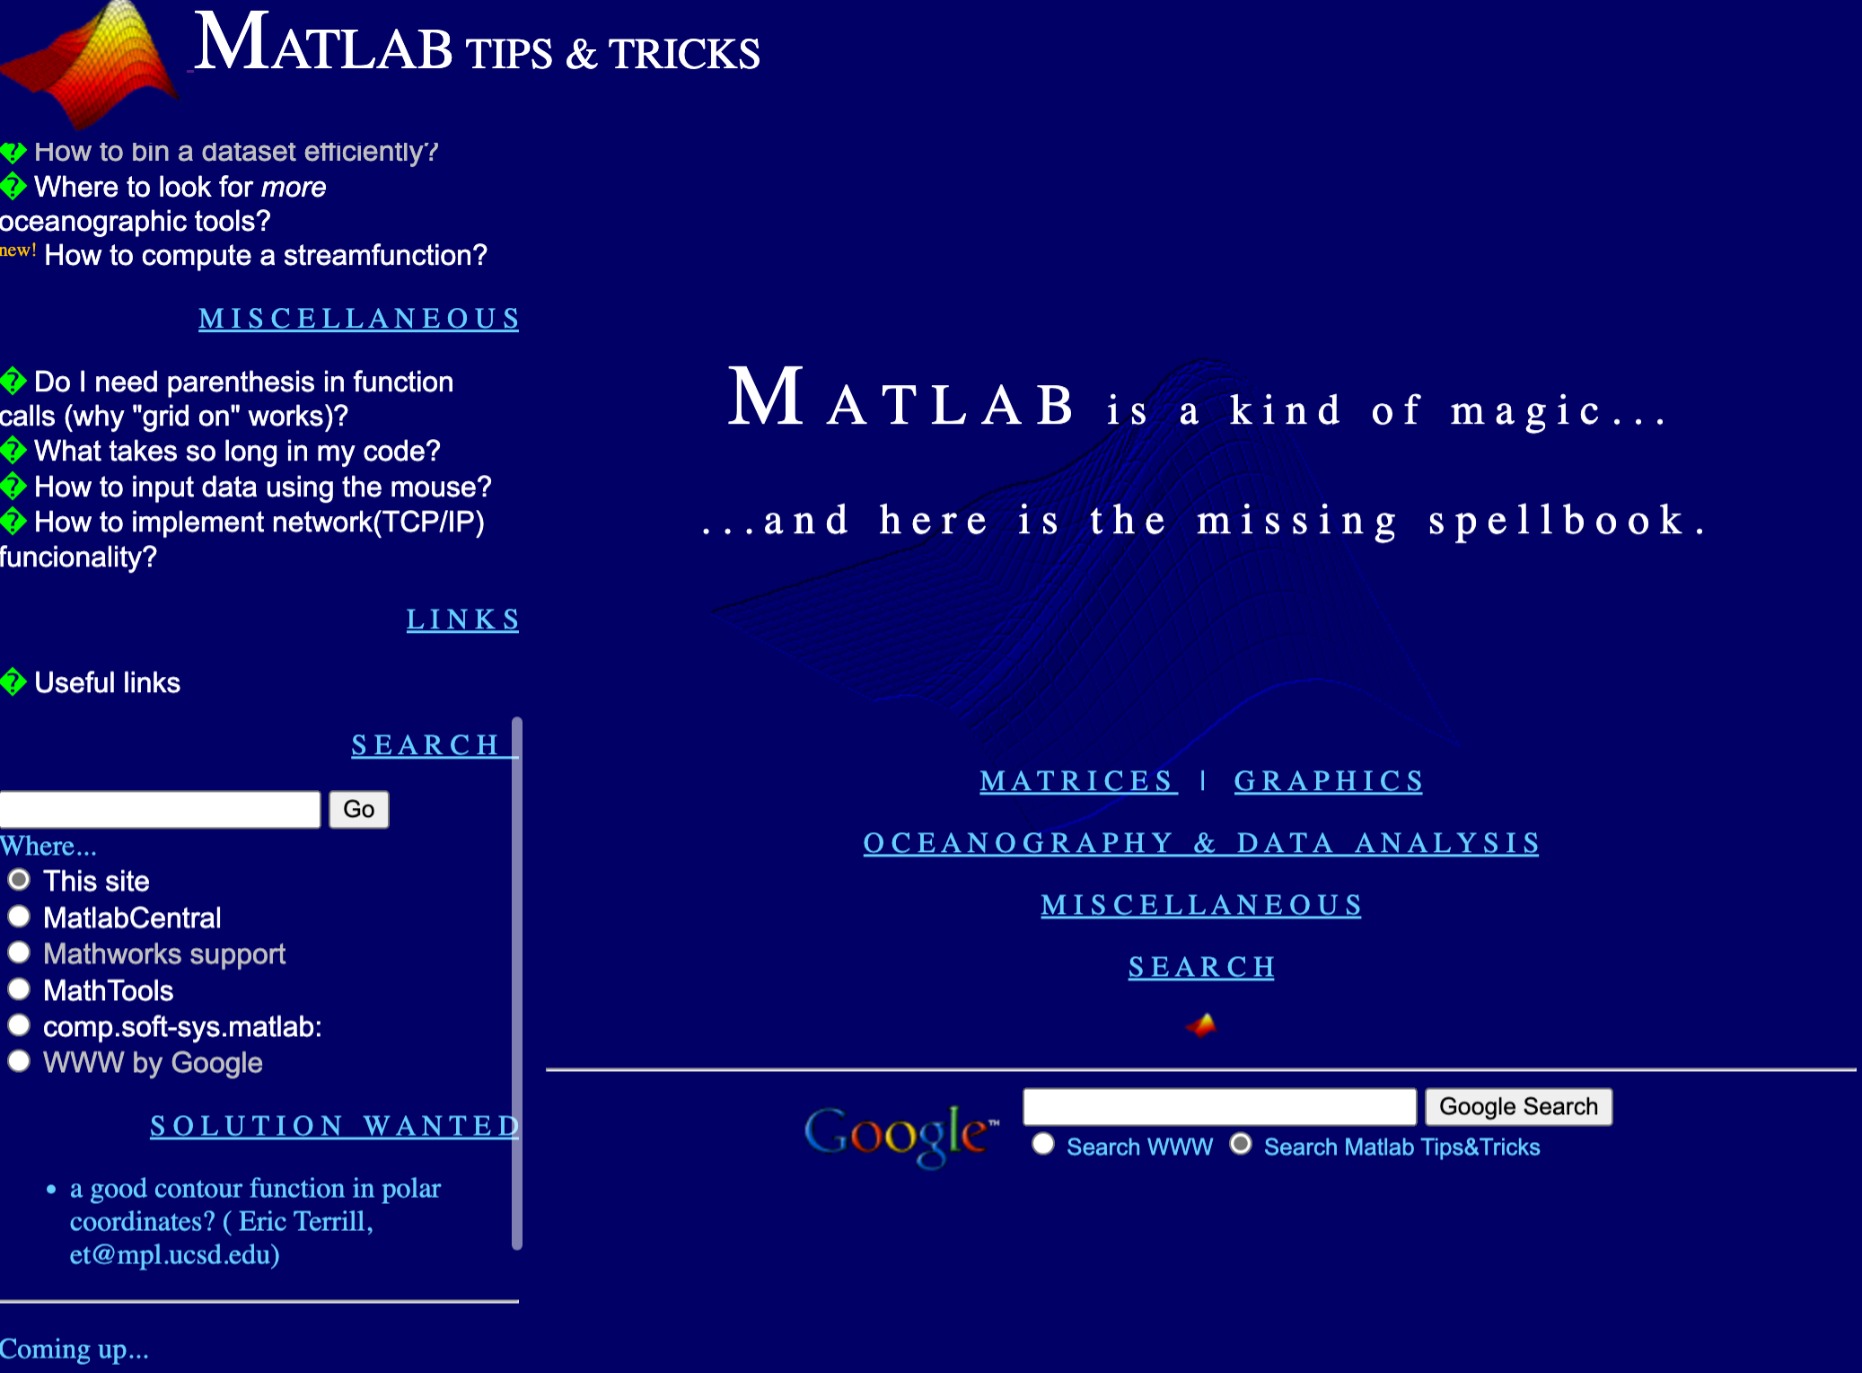
I feel like no one at UC San Diego knows this page, let alone this server, is still live. For the younger generation, this is what the whole internet used to look like :)
In short: support varying color in at least the plot, plot3, fplot, and fplot3 functions.
This has been a thing that's come up quite a few times, and includes questions/requests by users, workarounds by the community, and workarounds presented by MathWorks -- examples of each below. It's a feature that exists in Python's Matplotlib library and Sympy. Anyways, given that there are myriads of workarounds, it appears to be one of the most common requests for Matlab plots (Matlab's plotting is, IMO, one of the best features of the product), the request precedes the 21st century, and competitive tools provide the functionality, it would seem to me that this might be the next great feature for Matlab plotting.
I'm curious to get the rest of the community's thoughts... what's everyone else think about this?
---
User questions/requests
- https://www.mathworks.com/matlabcentral/answers/480389-colored-line-plot-according-to-a-third-variable
- https://www.mathworks.com/matlabcentral/answers/2092641-how-to-solve-a-problem-with-the-generation-of-multiple-colored-segments-on-one-line-in-matlab-plot
- https://www.mathworks.com/matlabcentral/answers/5042-how-do-i-vary-color-along-a-2d-line
- https://www.mathworks.com/matlabcentral/answers/1917650-how-to-plot-a-trajectory-with-varying-colour
- https://www.mathworks.com/matlabcentral/answers/1917650-how-to-plot-a-trajectory-with-varying-colour
- https://www.mathworks.com/matlabcentral/answers/511523-how-to-create-plot3-varying-color-figure
- https://www.mathworks.com/matlabcentral/answers/393810-multiple-colours-in-a-trajectory-plot
- https://www.mathworks.com/matlabcentral/answers/523135-creating-a-rainbow-colour-plot-trajectory
- https://www.mathworks.com/matlabcentral/answers/469929-how-to-vary-the-color-of-a-dynamic-line
- https://www.mathworks.com/matlabcentral/answers/585011-how-could-i-adjust-the-color-of-multiple-lines-within-a-graph-without-using-the-default-matlab-colo
- https://www.mathworks.com/matlabcentral/answers/517177-how-to-interpolate-color-along-a-curve-with-specific-colors
- https://www.mathworks.com/matlabcentral/answers/281645-variate-color-depending-on-the-y-value-in-plot
- https://www.mathworks.com/matlabcentral/answers/439176-how-do-i-vary-the-color-along-a-line-in-polar-coordinates
- https://www.mathworks.com/matlabcentral/answers/1849193-creating-rainbow-coloured-plots-in-3d
- https://groups.google.com/g/comp.soft-sys.matlab/c/cLgjSeEC15I?hl=en&pli=1 (a question asked in 1999!)
- ... the list goes on, and on, and on...
User-provided workarounds
- https://undocumentedmatlab.com/articles/plot-line-transparency-and-color-gradient
- https://www.mathworks.com/matlabcentral/fileexchange/19476-colored-line-or-scatter-plot
- https://www.mathworks.com/matlabcentral/fileexchange/23566-3d-colored-line-plot
- https://www.mathworks.com/matlabcentral/fileexchange/30423-conditionally-colored-line-plot
- https://www.mathworks.com/matlabcentral/fileexchange/14677-cline
- https://www.mathworks.com/matlabcentral/fileexchange/8597-plot-3d-color-line
- https://www.mathworks.com/matlabcentral/fileexchange/39972-colormapline-color-changing-2d-or-3d-line
- https://www.mathworks.com/matlabcentral/fileexchange/37725-conditionally-colored-plot-ccplot
- https://www.mathworks.com/matlabcentral/fileexchange/11611-linear-2d-plot-with-rainbow-color
- https://www.mathworks.com/matlabcentral/fileexchange/26692-color_line
- https://www.mathworks.com/matlabcentral/fileexchange/32911-plot3rgb
- And perhaps more?
MathWorks-provided workarounds
- https://www.mathworks.com/videos/coloring-a-line-based-on-height-gradient-or-some-other-value-in-matlab-97128.html
- https://www.mathworks.com/videos/making-a-multi-color-line-in-matlab-97127.html
- https://www.mathworks.com/matlabcentral/fileexchange/95663-color-trajectory-plot (contributed by a MathWorks staff member)
- And perhaps more?
isempty( [ ] )
10%
isempty( { } )
13%
isempty( '' ) % 2 single quotes
13%
isempty( "" ) % 2 double quotes
24%
c = categorical( [ ] ); isempty(c)
18%
s = struct("a", [ ] ); isempty(s.a)
22%
1324 个投票
Looking for 10 candidates for a closed beta on new MATLAB live script features.
Do you use live scripts regularly in MATLAB? Do you collaborate with others using live scripts?
MathWorks is looking for 10 candidates for a closed beta on new features for live scripts. Help us develop exciting new features with your feedback.
If you are selected, you will receive an email invitation to sign an NDA
I will post here when the quota is filled

The image was created with DALL-E 3.
Hello, brilliant minds of our engineering community!
We hope this message finds you in the midst of an exciting project or, perhaps, deep in the realms of a challenging problem, because we've got some groundbreaking news that might just make your day a whole lot more interesting.

🎉 Introducing PreAnswer AI - The Future of Community Support! 🎉
Have you ever found yourself pondering over a complex problem, wishing for an answer to magically appear before you even finish formulating the question? Well, wish no more! The MathWorks team, in collaboration with the most imaginative minds from the realms of science fiction, is thrilled to announce the launch of PreAnswer AI, an unprecedented feature set to revolutionize the way we interact within our MATLAB and Simulink community.
What is PreAnswer AI?
PreAnswer AI is our latest AI-driven initiative designed to answer your questions before you even ask them. Yes, you read that right! Through a combination of predictive analytics, machine learning, and a pinch of engineering wizardry, PreAnswer AI anticipates the challenges you're facing and provides you with solutions, insights, and code snippets in real-time.
How Does It Work?
- Presentiment Algorithms: By simply logging into MATLAB Central, our AI begins to analyze your recent coding patterns, activity, and even the intensity of your keyboard strokes to understand your current state of mind.
- Predictive Insights: Using a complex algorithm, affectionately dubbed "The Oracle", PreAnswer AI predicts the questions you're likely to ask and compiles comprehensive answers from our vast database of resources.
- Efficiency and Speed: Imagine the time saved when the answers to your questions are already waiting for you. PreAnswer AI ensures you spend more time innovating and less time searching for solutions.
We are on the cusp of deploying PreAnswer AI in a beta phase and are eager for you to be among the first to experience its benefits. Your feedback will be invaluable as we refine this feature to better suit our community's needs.
---------------------------------------------------------------
Spoiler, it's April 1st if you hadn't noticed. While we might not (yet) have the technology to read minds or predict the future, we do have an incredible community filled with knowledgeable, supportive members ready to tackle any question you throw their way.
Let's continue to collaborate, innovate, and solve complex problems together, proving that while AI can do many things, the power of a united community of brilliant minds is truly unmatched.
Thank you for being such a fantastic part of our community. Here's to many more questions, answers, and shared laughs along the way.
Happy April Fools' Day!
More than 500,000 people have subscribed to the MATLAB channel. MathWorks would like to thank everyone who has taken the time to watch one of our videos, leave us a comment, or share our videos with others. Together we’re accelerating the pace of engineering and science.
I would like to propose the creation of MATLAB EduHub, a dedicated channel within the MathWorks community where educators, students, and professionals can share and access a wealth of educational material that utilizes MATLAB. This platform would act as a central repository for articles, teaching notes, and interactive learning modules that integrate MATLAB into the teaching and learning of various scientific fields.
Key Features:
1. Resource Sharing: Users will be able to upload and share their own educational materials, such as articles, tutorials, code snippets, and datasets.
2. Categorization and Search: Materials can be categorized for easy searching by subject area, difficulty level, and MATLAB version..
3. Community Engagement: Features for comments, ratings, and discussions to encourage community interaction.
4. Support for Educators: Special sections for educators to share teaching materials and track engagement.
Benefits:
- Enhanced Educational Experience: The platform will enrich the learning experience through access to quality materials.
- Collaboration and Networking: It will promote collaboration and networking within the MATLAB community.
- Accessibility of Resources: It will make educational materials available to a wider audience.
By establishing MATLAB EduHub, I propose a space where knowledge and experience can be freely shared, enhancing the educational process and the MATLAB community as a whole.
In one line of MATLAB code, compute how far you can see at the seashore. In otherwords, how far away is the horizon from your eyes? You can assume you know your height and the diameter or radius of the earth.
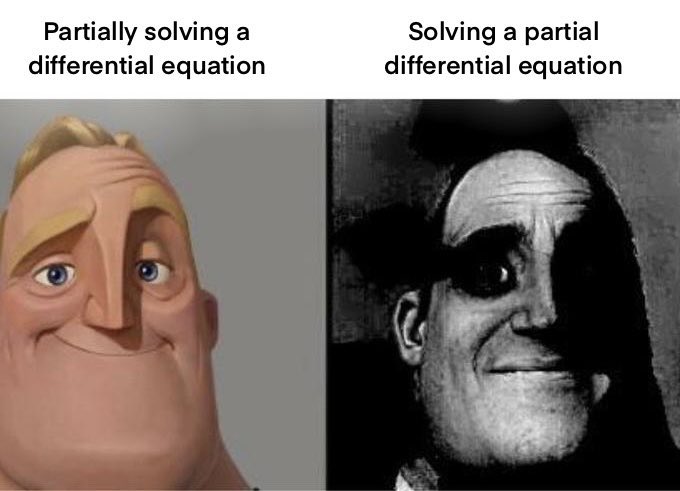
Keep calm and study PDEs
Me at the beginning of every meeting

A bit late. Compliments to Chris for sharing.
Hey MATLAB Community! 🌟
March has been bustling with activity on MATLAB Central, bringing forth a treasure trove of insights, innovations, and fun. Whether you're delving into the intricacies of spline conversions or seeking inspiration from Pi Day celebrations, there's something for everyone.
Here’s a roundup of the top posts from the past few weeks that you won't want to miss:
Interesting questions
Dive into the technicalities of converting spline forms with a focus on calculating coefficients. A must-read for anyone dealing with spline representations.
Explore the challenges and solutions in tuning autopilot gains within a non-linear model of a business jet aircraft.
Popular discussions
Celebrate Pi Day with cool MATLAB implementations and code. A delightful read filled with π-inspired creativity.
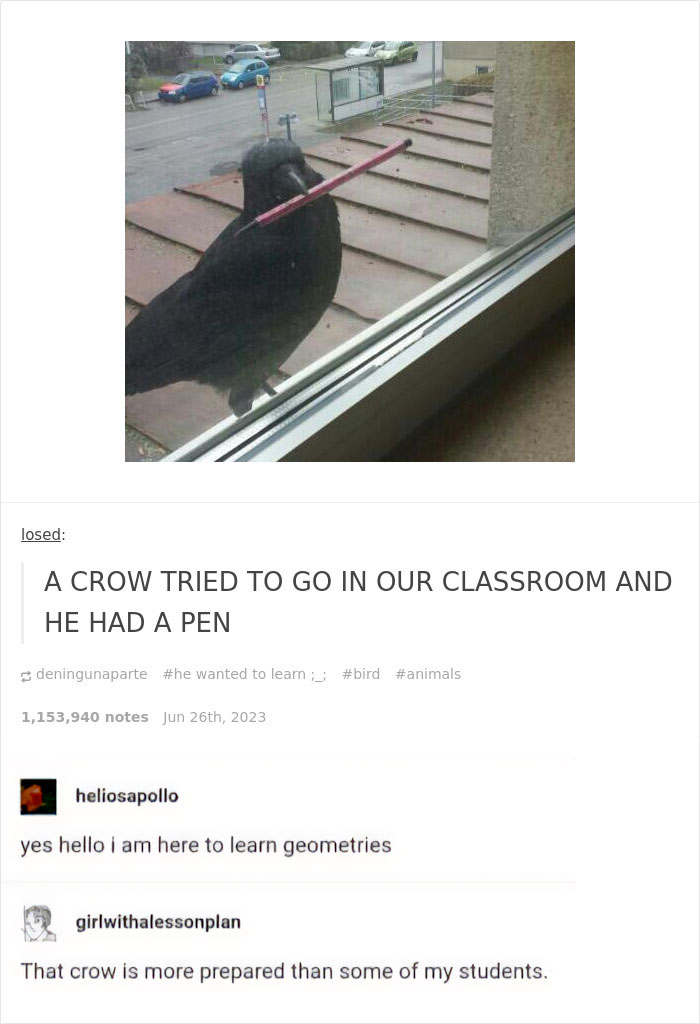
Get a glimpse of fun with MATLAB through an engaging visual shared by Athanasios. A light-hearted thread that showcases the fun side of mathematics.
From File Exchange
Unlock the secrets of global climate data with MATLAB. This thread offers tools and insights for analyzing precipitation variability.
Interact with a numerical puddle in real-time and explore the dynamics of disturbances. A fascinating exploration of fluid dynamics simulation.
From the Blogs
Revisit Pi Day with Jiro's picks of the coolest π visualizations. A post that combines art, math, and the joy of exploration.
Discover the synergy between MATLAB and Visual Studio Code, enhanced by GitHub Copilot support. A game-changer for MATLAB developers.
These threads are just the tip of the iceberg. Each post is a gateway to new knowledge, ideas, and community connections. Dive in, explore, and don't forget to contribute your insights and questions. Together, we make MATLAB Central a vibrant hub of innovation and support.
Happy Coding!
sort(v)
8%
unique(v)
16%
union(v, [ ])
17%
intersect(v, v)
14%
setdiff(v, [ ])
12%
All return sorted output
33%
1193 个投票
can you relate?
Can you solve it?
We are thrilled to announce the launch of a brand-new area within the MATLAB Central community – 'Discussions'. This exciting addition is designed to foster a stronger and more connected community.
Discover the 'Tips & Tricks' Channel
At the heart of 'Discussions' is the 'Tips & Tricks' channel. This is your ultimate destination for both sharing and discovering the best MATLAB tips.
Whether you're a seasoned MATLAB user with wisdom to share or a newcomer seeking advice, this channel is your platform. Here, you can post your own insights, ask for guidance on specific topics, and uncover hidden gems that can transform your MATLAB experience. It's more than just a channel; it's a community learning together; it’s your community blog!
More Than Just Tips
The 'Discussions' area offers much more. Explore the 'Ideas'channel to share and debate innovative product ideas. Dive into the 'Fun'channel to enjoy memes and light-hearted content with fellow MATLAB enthusiasts. Or wander into 'Off Topic'for intriguing discussions that might not be related to MATLAB.
Follow the channels!
We highly encourage every member of the MATLAB Central community to follow the channels you are interested in and participate in 'Discussions'. Together, we can achieve more, learn more, and connect more.

s = ['M','A','T','L','A','B']
9%
char([77,65,84,76,65,66])
7%
"MAT" + "LAB"
21%
upper(char('matlab' - '0' + 48))
17%
fliplr("BALTAM")
17%
rot90(rot90('BALTAM'))
30%
2929 个投票
The File Exchange team is thrilled to introduce a more streamlined approach to working with GitHub and File Exchange - the MATLAB and Simulink Integration for GitHub!
Key Enhancements:
- Improves the existing connection between File Exchange and GitHub, ensuring quicker reflection of changes made in GitHub within File Exchange.
- Aligns with GitHub's standard and supported approach to building integrations.
Action Required for File Exchange Contributors!
If you are a File Exchange contributor and have linked any submissions to GitHub, it is essential to install the App.
Starting April 16, 2024, your File Exchange submissions will no longer update automatically unless you take the following steps:
2. Follow the prompts on the page to install MATLAB and Simulink Integration for GitHub.
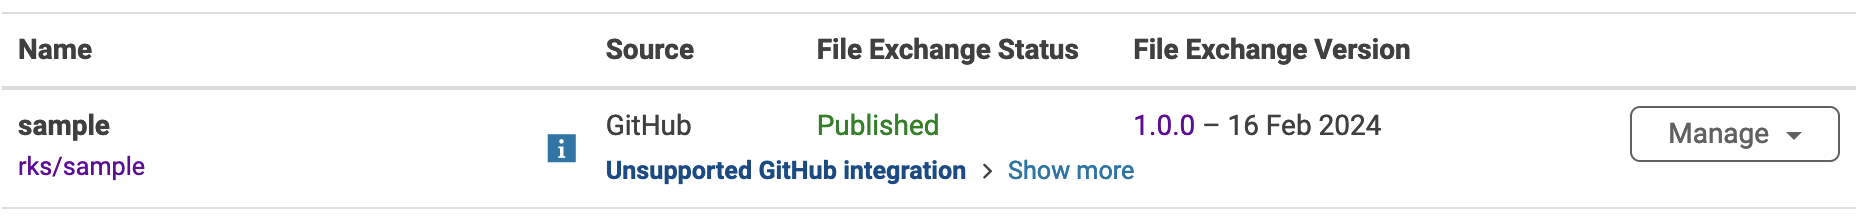
3. Complete the necessary steps in GitHub.
4. Return to the My File Exchange page and verify the installation.
If you prefer your File Exchange submission not to update automatically from GitHub, no action is required. Users will still be able to find and download your submissions. However, to release a new version of your code, you must either install the GitHub App or disconnect from GitHub and manually upload new versions of your code.
Should you have any questions or encounter issues with the App, please feel free to comment on this post!
Several of the colormaps are great for a 256 color surface plot, but aren't well optimized for extracting m colors for plotting several independent lines. The issue is that many colormaps have start/end colors that are too similar or are suboptimal colors for lines. There are certainly many workarounds for this, but it would be a great quality of life to adjust that directly when calling this.
Example:
x = linspace(0,2*pi,101)';
y = [1:6].*cos(x);
figure; plot(x,y,'LineWidth',2); grid on; axis tight;
And now if I wanted to color these lines, I could use something like turbo(6) or gray(6) and then apply it using colororder.
colororder(turbo(6))
But my issue is that the ends of the colormap are too similar. For other colormaps, you may get lines that are too light to be visible against the white background. There are plenty of workarounds, with my preference being to create extra colors and truncate that before using colororder.
cmap = turbo(8); cmap = cmap(2:end-1,:); % Truncate the end colors
figure; plot(x,y,'LineWidth',2); grid on; axis tight;
colororder(cmap)
I think it would be really awesome to add some name-argument input pair to these colormaps that can specify the range you want so this could even be done inside the colororder calling if desired. An example of my proposed solution would look something like this:
cmap = turbo(6,'Range',[0.1 0.8]); % Proposed idea to add functionality
Where in this scenario, the resulting colormap would be 6 equally spaced colors that range from 10% to 80% of the total color range. This would be especially nice because you could more quickly modify the range of colors, or you could set the limits regardless of whether you need to plot 3, 6, or 20 lines.
您也可以从以下列表中选择网站:
美洲
- América Latina (Español)
- Canada (English)
- United States (English)
欧洲
- Belgium (English)
- Denmark (English)
- Deutschland (Deutsch)
- España (Español)
- Finland (English)
- France (Français)
- Ireland (English)
- Italia (Italiano)
- Luxembourg (English)
- Netherlands (English)
- Norway (English)
- Österreich (Deutsch)
- Portugal (English)
- Sweden (English)
- Switzerland
- United Kingdom(English)
亚太
- Australia (English)
- India (English)
- New Zealand (English)
- 中国
- 日本Japanese (日本語)
- 한국Korean (한국어)