搜索
An option for 10th degree polynomials but no weighted linear least squares. Seriously? Jesse
Hello, everyone! I’m Mark Hayworth, but you might know me better in the community as Image Analyst. I've been using MATLAB since 2006 (18 years). My background spans a rich career as a former senior scientist and inventor at The Procter & Gamble Company (HQ in Cincinnati). I hold both master’s & Ph.D. degrees in optical sciences from the College of Optical Sciences at the University of Arizona, specializing in imaging, image processing, and image analysis. I have 40+ years of military, academic, and industrial experience with image analysis programming and algorithm development. I have experience designing custom light booths and other imaging systems. I also work with color and monochrome imaging, video analysis, thermal, ultraviolet, hyperspectral, CT, MRI, radiography, profilometry, microscopy, NIR, and Raman spectroscopy, etc. on a huge variety of subjects.
I'm thrilled to participate in MATLAB Central's Ask Me Anything (AMA) session, a fantastic platform for knowledge sharing and community engagement. Following Adam Danz’s insightful AMA on staff contributors in the Answers forum, I’d like to discuss topics in the area of image analysis and processing. I invite you to ask me anything related to this field, whether you're seeking recommendations on tools, looking for tips and tricks, my background, or career development advice. Additionally, I'm more than willing to share insights from my experiences in the MATLAB Answers community, File Exchange, and my role as a member of the Community Advisory Board. If you have questions related to your specific images or your custom MATLAB code though, I'll invite you to ask those in the Answers forum. It's a more appropriate forum for those kinds of questions, plus you can get the benefit of other experts offering their solutions in addition to me.
For the coming weeks, I'll be here to engage with your questions and help shed light on any topics you're curious about.
Hello, everyone!
Over the past few weeks, our community has been buzzing with activity, showcasing the incredible depth of knowledge, creativity, and innovation that makes this forum such a vibrant place. Today, we're excited to highlight some of the noteworthy contributions that have sparked discussions, offered insights, and shared knowledge across various topics. Let's dive in!
Interesting Questions
Fatima Majeed brings us a thought-provoking mathematical challenge, delving into inequalities and the realms beyond (e^e). If you're up for a mathematical journey, this question is a must-see!
lil brain tackles a practical problem many of us have faced: efficiently segmenting a CSV file based on specific criteria. This post is not only a query but a learning opportunity for anyone dealing with similar data manipulation challenges.
Popular Discussions
Discover a simple yet effective trick for digit manipulation from goc3. This tip is especially handy for those frequenting Cody challenges or anyone interested in enhancing their number handling skills in MATLAB.
Chen Lin shares an exciting update about the 'Run Code' feature in the Discussions area, highlighting how our community can now directly execute and share code snippets within discussions. This feature marks a significant enhancement in how we interact and solve problems together.
From the Blogs
A Deep Dive into EEG Analysis for Predicting Neurological Outcomes By Tanya Kuruvilla
Connell D`Souza, alongside Team Swarthbeat, explores the cutting-edge application of EEG analysis in predicting neurological outcomes post-cardiac arrest. This blog post offers an in-depth look into the challenges and methodologies of modern medical data analysis.
Mihir Acharya discusses the pivotal role of MATLAB and Simulink in the future of robotics simulation. Through an engaging conversation with industry analyst George Chowdhury, this post sheds light on overcoming simulation challenges and the exciting possibilities that lie ahead.
We encourage everyone to explore these contributions further and engage with the authors and the community. Your participation is what fuels this community's continual growth and innovation.
Here's to many more discussions, discoveries, and breakthroughs together!
Twitch built an entire business around letting you watch over someone's shoulder while they play video games. I feel like we should be able to make at least a few videos where we get to watch over someone's shoulder while they solve Cody problems. I would pay good money for a front-row seat to watch some of my favorite solvers at work. Like, I want to know, did Alfonso Nieto-Castonon just sit down and bang out some of those answers, or did he have to think about it for a while? What was he thinking about while he solved it? What resources was he drawing on? There's nothing like watching a master craftsman at work.
I can imagine a whole category of Cody videos called "How I Solved It". I tried making one of these myself a while back, but as far as I could tell, nobody else made one.
Here's the direct link to the video: https://www.youtube.com/watch?v=hoSmO1XklAQ
I hereby challenge you to make a "How I Solved It" video and post it here. If you make one, I'll make another one.
We're thrilled to share an exciting update with our community: the 'Run Code' feature is now available in the Discussions area!
Simply insert your code into the editor and press the green triangle button to run it. Your code will execute using the latest MATLAB R24a version, and it supports most common toolboxes. Moreover, this innovative feature allows for the running of attached files, further enhancing its utility and flexibility.
The ‘run code’ feature was first introduced in MATLAB Answers. Encouraged by the positive feedback and at the request of our community members, we are now expanding the availability of this feature to more areas within our community.
As always, your feedback is crucial to us, so please don't hesitate to share your thoughts and experiences by leaving a comment.
The Ans Hack is a dubious way to shave a few points off your solution score. Instead of a standard answer like this
function y = times_two(x)
y = 2*x;
end
you would do this
function ans = times_two(x)
2*x;
end
The ans variable is automatically created when there is no left-hand side to an evaluated expression. But it makes for an ugly function. I don't think anyone actually defends it as a good practice. The question I would ask is: is it so offensive that it should be specifically disallowed by the rules? Or is it just one of many little hacks that you see in Cody, inelegant but tolerable in the context of the surrounding game?
Incidentally, I wrote about the Ans Hack long ago on the Community Blog. Dealing with user-unfriendly code is also one of the reasons we created the Head-to-Head voting feature. Some techniques are good for your score, and some are good for your code readability. You get to decide with you care about.
Many MATLAB enthusiasts come Cody to sharpen their skills, face new challenges, and engage in friendly competition. We firmly believe that learning from peers is one of the most effective ways to grow.
With this in mind, the Cody team is thrilled to unveil a new feature aimed at enriching your learning journey: the Cody Discussion Channel. This space is designed for sharing expertise, acquiring new skills, and fostering connections within our community.
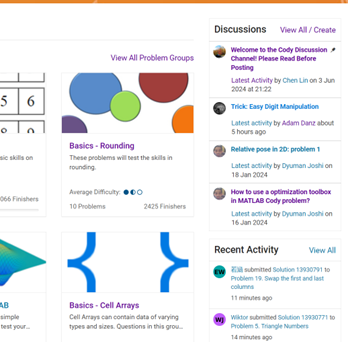
On the Cody homepage, you'll now notice a Discussions section, prominently displaying the four most recent posts. For those eager to contribute, we encourage you to familiarize yourself with our posting guidelines before creating a new post. This will help maintain a constructive and valuable exchange of ideas for everyone involved.
Together, let's create an environment where every member feels empowered to share, learn, and connect.
There are a host of problems on Cody that require manipulation of the digits of a number. Examples include summing the digits of a number, separating the number into its powers, and adding very large numbers together.
If you haven't come across this trick yet, you might want to write it down (or save it electronically):
digits = num2str(4207) - '0'
That code results in the following:
digits =
4 2 0 7
Now, summing the digits of the number is easy:
sum(digits)
ans =
13
Hello and a warm welcome to everyone! We're excited to have you in the Cody Discussion Channel. To ensure the best possible experience for everyone, it's important to understand the types of content that are most suitable for this channel.
Content that belongs in the Cody Discussion Channel:
- Tips & tricks: Discuss strategies for solving Cody problems that you've found effective.
- Ideas or suggestions for improvement: Have thoughts on how to make Cody better? We'd love to hear them.
- Issues: Encountering difficulties or bugs with Cody? Let us know so we can address them.
- Requests for guidance: Stuck on a Cody problem? Ask for advice or hints, but make sure to show your efforts in attempting to solve the problem first.
- General discussions: Anything else related to Cody that doesn't fit into the above categories.
Content that does not belong in the Cody Discussion Channel:
- Comments on specific Cody problems: Examples include unclear problem descriptions or incorrect testing suites.
- Comments on specific Cody solutions: For example, you find a solution creative or helpful.
Please direct such comments to the Comments section on the problem or solution page itself.
We hope the Cody discussion channel becomes a vibrant space for sharing expertise, learning new skills, and connecting with others.
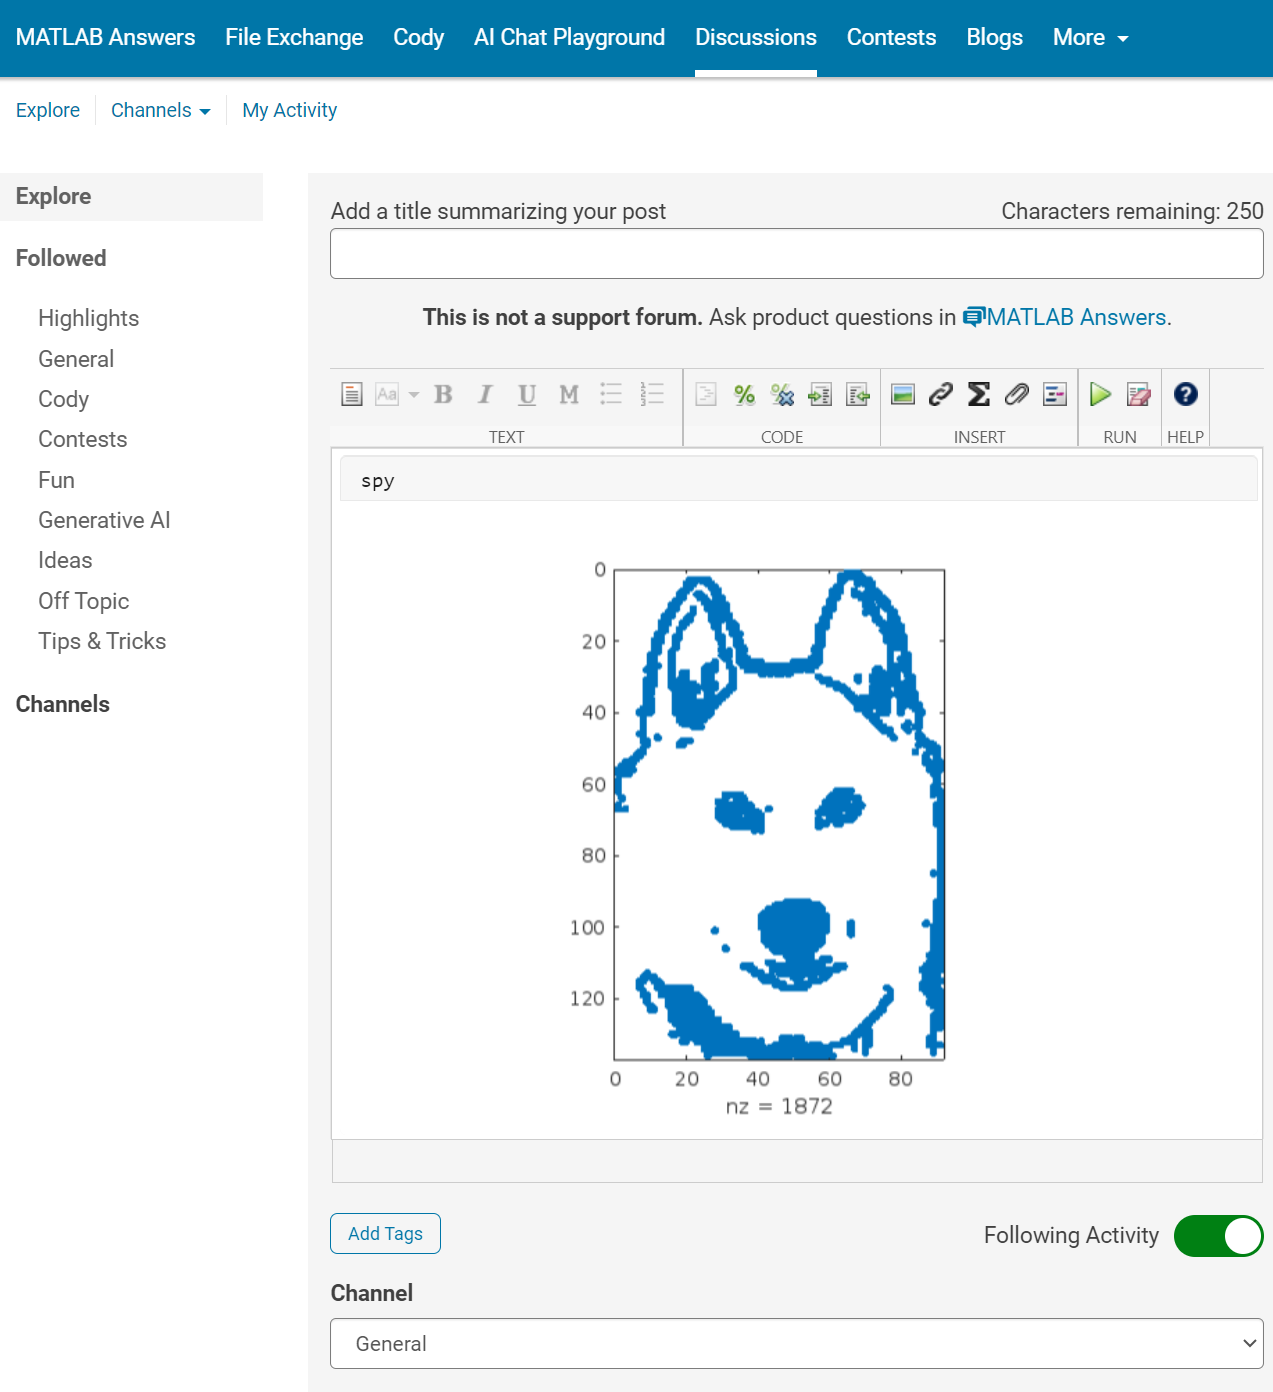
Spring is here in Natick and the tulips are blooming! While tulips appear only briefly here in Massachusetts, they provide a lot of bright and diverse colors and shapes. To celebrate this cheerful flower, here's some code to create your own tulip!

Hello MATLAB Community!
We've had an exciting few weeks filled with insightful discussions, innovative tools, and engaging blog posts from our vibrant community. Here's a highlight of some noteworthy contributions that have sparked interest and inspired us all. Let's dive in!
Interesting Questions
Cindyawati explores the intriguing concept of interrupting continuous data in differential equations to study the effects of drug interventions in disease models. A thought-provoking question that bridges mathematics and medical research.
Pedro delves into the application of Linear Quadratic Regulator (LQR) for error dynamics and setpoint tracking, offering insights into control systems and their real-world implications.
Popular Discussions
Chen Lin shares an engaging interview with Zhaoxu Liu, shedding light on the creative processes behind some of the most innovative MATLAB contest entries of 2023. A must-read for anyone looking for inspiration!
Zhaoxu Liu, also known as slanderer, updates the community with the latest version of the MATLAB Plot Cheat Sheet. This resource is invaluable for anyone looking to enhance their data visualization skills.
From File Exchange
Giorgio introduces a toolbox for frequency estimation, making it simpler for users to import signals directly from the MATLAB workspace. A significant contribution for signal processing enthusiasts.
From the Blogs
Cleve Moler revisits a classic program for predicting future trends based on census data, offering a fascinating glimpse into the evolution of computational forecasting.
Boost Your App Design Efficiency – Effortless Component Swapping & Labeling in App Designer by Adam Danz
With contributions from Dinesh Kavalakuntla, Adam presents an insightful guide on improving app design workflows in MATLAB App Designer, focusing on component swapping and labeling.
We're incredibly proud of the diverse and innovative contributions our community members make every day. Each post, discussion, and tool not only enriches our knowledge but also inspires others to explore and create. Let's continue to support and learn from each other as we advance in our MATLAB journey.
Happy Coding!
quick / easy
21%
themed / in a group
20%
challenge (e.g., banned functions)
13%
puzzle / game
16%
educational
28%
other (comment below)
3%
117 个投票
Drumlin Farm has welcomed MATLAMB, named in honor of MathWorks, among ten adorable new lambs this season!

I found this plot of words said by different characters on the US version of The Office sitcom. There's a sparkline for each character from pilot to finale episode.
RGB triplet [0,1]
9%
RGB triplet [0,255]
12%
Hexadecimal Color Code
13%
Indexed color
16%
Truecolor array
37%
Equally unfamiliar with all-above
13%
2784 个投票
A high school student called for help with this physics problem:

- Car A moves with constant velocity v.
- Car B starts to move when Car A passes through the point P.
- Car B undergoes...
- uniform acc. motion from P to Q.
- uniform velocity motion from Q to R.
- uniform acc. motion from R to S.
- Car A and B pass through the point R simultaneously.
- Car A and B arrive at the point S simultaneously.
Q1. When car A passes the point Q, which is moving faster?
Q2. Solve the time duration for car B to move from P to Q using L and v.
Q3. Magnitude of acc. of car B from P to Q, and from R to S: which is bigger?
Well, it can be solved with a series of tedious equations. But... how about this?

Code below:
%% get images and prepare stuffs
figure(WindowStyle="docked"),
ax1 = subplot(2,1,1);
hold on, box on
ax1.XTick = [];
ax1.YTick = [];
A = plot(0, 1, 'ro', MarkerSize=10, MarkerFaceColor='r');
B = plot(0, 0, 'bo', MarkerSize=10, MarkerFaceColor='b');
[carA, ~, alphaA] = imread('https://cdn.pixabay.com/photo/2013/07/12/11/58/car-145008_960_720.png');
[carB, ~, alphaB] = imread('https://cdn.pixabay.com/photo/2014/04/03/10/54/car-311712_960_720.png');
carA = imrotate(imresize(carA, 0.1), -90);
carB = imrotate(imresize(carB, 0.1), 180);
alphaA = imrotate(imresize(alphaA, 0.1), -90);
alphaB = imrotate(imresize(alphaB, 0.1), 180);
carA = imagesc(carA, AlphaData=alphaA, XData=[-0.1, 0.1], YData=[0.9, 1.1]);
carB = imagesc(carB, AlphaData=alphaB, XData=[-0.1, 0.1], YData=[-0.1, 0.1]);
txtA = text(0, 0.85, 'A', FontSize=12);
txtB = text(0, 0.17, 'B', FontSize=12);
yline(1, 'r--')
yline(0, 'b--')
xline(1, 'k--')
xline(2, 'k--')
text(1, -0.2, 'Q', FontSize=20, HorizontalAlignment='center')
text(2, -0.2, 'R', FontSize=20, HorizontalAlignment='center')
% legend('A', 'B') % this make the animation slow. why?
xlim([0, 3])
ylim([-.3, 1.3])
%% axes2: plots velocity graph
ax2 = subplot(2,1,2);
box on, hold on
xlabel('t'), ylabel('v')
vA = plot(0, 1, 'r.-');
vB = plot(0, 0, 'b.-');
xline(1, 'k--')
xline(2, 'k--')
xlim([0, 3])
ylim([-.3, 1.8])
p1 = patch([0, 0, 0, 0], [0, 1, 1, 0], [248, 209, 188]/255, ...
EdgeColor = 'none', ...
FaceAlpha = 0.3);
%% solution
v = 1; % car A moves with constant speed.
L = 1; % distances of P-Q, Q-R, R-S
% acc. of car B for three intervals
a(1) = 9*v^2/8/L;
a(2) = 0;
a(3) = -1;
t_BatQ = sqrt(2*L/a(1)); % time when car B arrives at Q
v_B2 = a(1) * t_BatQ; % speed of car B between Q-R
%% patches for velocity graph
p2 = patch([t_BatQ, t_BatQ, t_BatQ, t_BatQ], [1, 1, v_B2, v_B2], ...
[248, 209, 188]/255, ...
EdgeColor = 'none', ...
FaceAlpha = 0.3);
p3 = patch([2, 2, 2, 2], [1, v_B2, v_B2, 1], [194, 234, 179]/255, ...
EdgeColor = 'none', ...
FaceAlpha = 0.3);
%% animation
tt = linspace(0, 3, 2000);
for t = tt
A.XData = v * t;
vA.XData = [vA.XData, t];
vA.YData = [vA.YData, 1];
if t < t_BatQ
B.XData = 1/2 * a(1) * t^2;
vB.XData = [vB.XData, t];
vB.YData = [vB.YData, a(1) * t];
p1.XData = [0, t, t, 0];
p1.YData = [0, vB.YData(end), 1, 1];
elseif t >= t_BatQ && t < 2
B.XData = L + (t - t_BatQ) * v_B2;
vB.XData = [vB.XData, t];
vB.YData = [vB.YData, v_B2];
p2.XData = [t_BatQ, t, t, t_BatQ];
p2.YData = [1, 1, vB.YData(end), vB.YData(end)];
else
B.XData = 2*L + v_B2 * (t - 2) + 1/2 * a(3) * (t-2)^2;
vB.XData = [vB.XData, t];
vB.YData = [vB.YData, v_B2 + a(3) * (t - 2)];
p3.XData = [2, t, t, 2];
p3.YData = [1, 1, vB.YData(end), v_B2];
end
txtA.Position(1) = A.XData(end);
txtB.Position(1) = B.XData(end);
carA.XData = A.XData(end) + [-.1, .1];
carB.XData = B.XData(end) + [-.1, .1];
drawnow
end
isstring
11%
ischar
7%
iscellstr
13%
isletter
21%
isspace
9%
ispunctuation
37%
2455 个投票
Dear MATLAB contest enthusiasts,
I believe many of you have been captivated by the innovative entries from Zhaoxu Liu / slanderer, in the 2023 MATLAB Flipbook Mini Hack contest.


Ever wondered about the person behind these creative entries? What drives a MATLAB user to such levels of skill? And what inspired his participation in the contest? We were just as curious as you are!
We were delighted to catch up with him and learn more about his use of MATLAB. The interview has recently been published in MathWorks Blogs. For an in-depth look into his insights and experiences, be sure to read our latest blog post: Community Q&A – Zhaoxu Liu.
But the conversation doesn't end here! Who would you like to see featured in our next interview? Drop their name in the comments section below and let us know who we should reach out to next!
Hey MATLAB Community! 🌟
In the vibrant landscape of our online community, the past few weeks have been particularly exciting. We've seen a plethora of contributions that not only enrich our collective knowledge but also foster a spirit of collaboration and innovation. Here are some of the noteworthy contributions from our members.
Interesting Questions
Victor encountered a puzzling error while trying to publish his script to PDF. His post sparked a helpful discussion on troubleshooting this issue, proving invaluable for anyone facing similar challenges.
Devendra's inquiry into interpolating and smoothing NDVI time series using MATLAB has opened up a dialogue on various techniques to manage noisy data, benefiting researchers and enthusiasts in the field of remote sensing.
Popular Discussions
Adam Danz's AMA session has been a treasure trove of insights into the workings behind the MATLAB Answers forum, offering a unique perspective from a staff contributor's viewpoint.
The User Following feature marks a significant enhancement in how community members can stay connected with the contributions of their peers, fostering a more interconnected MATLAB Central.
From File Exchange
Robert Haaring's submission is a standout contribution, providing a sophisticated model for CO2 electrolysis, a topic of great relevance to researchers in environmental technology and chemical engineering.
From the Blogs
Verification and Validation for AI: From model implementation to requirements validation by Sivylla Paraskevopoulou
Sivylla's comprehensive post delves into the critical stages of AI model development, from implementation to validation, offering invaluable guidance for professionals navigating the complexities of AI verification.
In this engaging Q&A, Ned Gulley introduces us to Zhaoxu Liu, a remarkable community member whose innovative contributions and active engagement have left a significant impact on the MATLAB community.
Each of these contributions highlights the diverse and rich expertise within our community. From solving complex technical issues to introducing new features and sharing in-depth knowledge on specialized topics, our members continue to make MATLAB Central a vibrant and invaluable resource.
Let's continue to support, inspire, and learn from one another
Don't use / What are Projects?
26%
1–10
31%
11–20
15%
21–30
9%
31–50
7%
51+ (comment below)
12%
4070 个投票