主要内容
搜索
You provided 10,958 anwers at the acceptance rate of 78.95% and received 3,126 votes. Thank you for your contribution to the community!
MATLAB Central Team
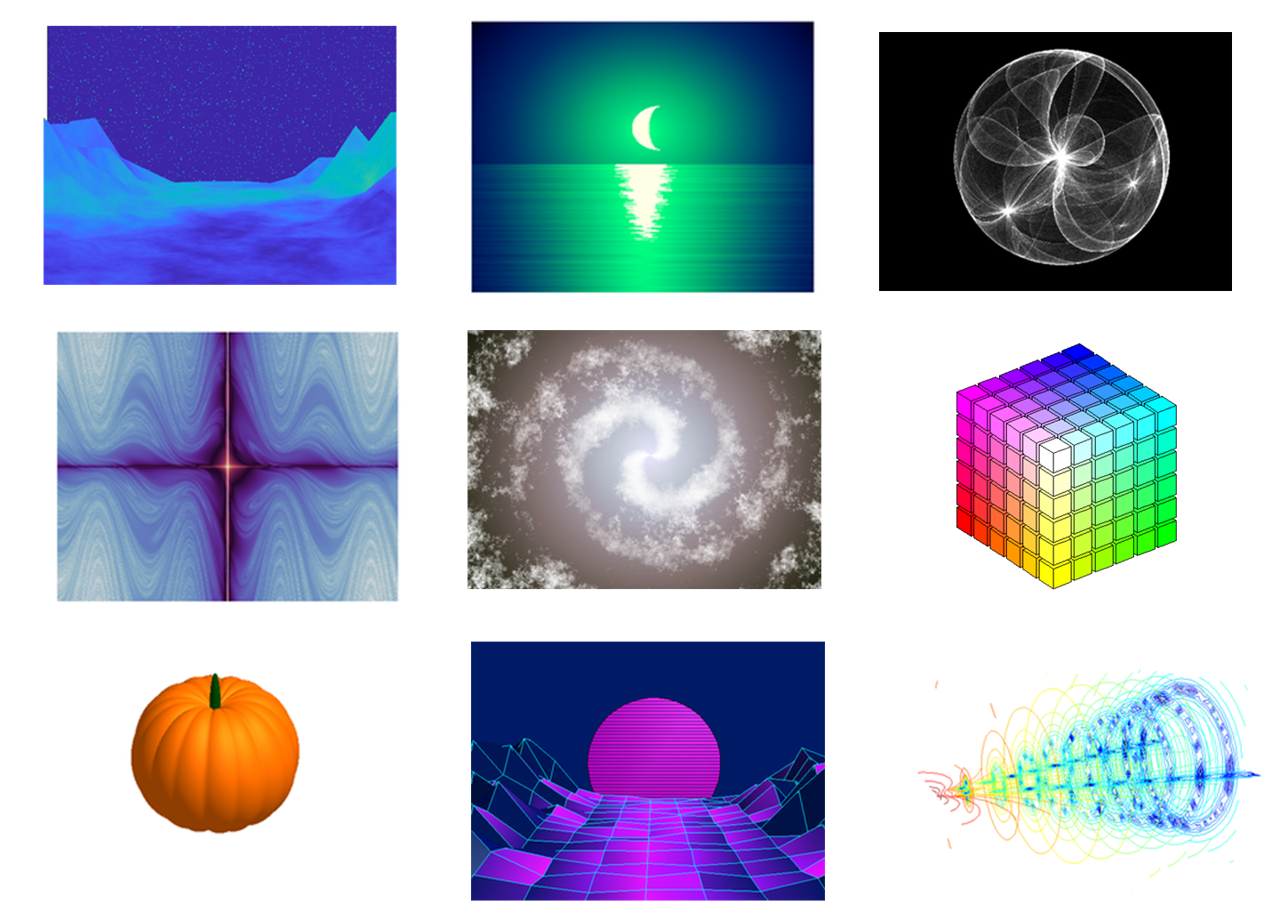
What amazing images can be created with no more than 280 characters of MATLAB code? Check out the GALLERY from the MATLAB Mini Hack 2022 contest.
Vote on your favorite MATLAB images before Oct. 30th! We will give out MathWorks T-shirt to 10 lucky voters.
How can I vote?
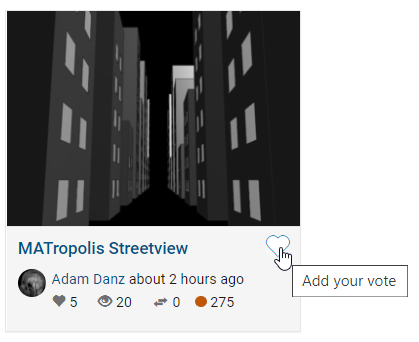
You can vote for an entry by clicking on the heart icon on an entry card or the vote button on the entry detail page.
New in R2022b: GridSizeChangedFcn
tiledlayout() creates a TiledChartLayout object that defines a gridded layout of axes within a figure. When using the 'flow' option, the grid size becomes dynamic and updates as axes are added or as the figure size changes. These features were introduced in R2019b and if you're still stuck on using subplot, you're missing out on several other great features of tiledlayout.
Starting in MATLAB R2022b you can define a callback function that responds to changes to the grid size in flow arrangements by setting the new gridSizeChangedFcn.
Use case
I often use a global legend to represent data across all axes within a figure. When the figure is tall and narrow, I want the legend to be horizontally oriented at the bottom of the figure but when the figure is short and wide, I prefer a vertically oriented legend on the right of the figure. By using the gridSizeChangedFcn, now I can update the legend location and orientation when the grid size changes.
Demo
gridSizeChangeFcn works like all other graphics callback functions. In this demo, I've named the gridSizeChangedFcn "updateLegendLayout", assigned by an anonymous function. The first input is the TiledChartLayout object and the second input is the event object that indicates the old and new grid sizes. The legend handle is also passed into the function. Since all of the tiles contain the same groups of data, the legend is based on data in the last tile.
As long as the legend is valid, the gridSizeChangedFcn updates the location and orientation of the legend so that when the grid is tall, the legend will be horizontal at the bottom of the figure and when the grid is wide, the legend will be vertical at the right of the figure.
Since the new grid size is available as a property in the TiledChartLayout object, I chose not to use the event argument. This way I can directly call the callback function at the end to update the legend without having to create an event.
Run this example from an m-file. Then change the width or height of the figure to demonstrate the legend adjustments.
% Prepare data
data1 = sort(randn(6))*10;
data2 = sort(randn(6))*10;
labels = ["A","B","C","D","E","F"];
groupLabels = categorical(["Control", "Test"]);
% Generate figure
fig = figure;
tcl = tiledlayout(fig, "flow", TileSpacing="compact", Padding="compact");
nTiles = height(data1);
h = gobjects(1,nTiles);
for i = 1:nTiles
ax = nexttile(tcl);
groupedData = [data1(i,:); data2(i,:)];
h = bar(ax,groupLabels, groupedData, "grouped");
title(ax,"condition " + i)
end
title(tcl,"GridSizeChangedFcn Demo")
ylabel(tcl,"Score")
legh = legend(h, labels);
title(legh,"Factors")
% Define and call the GridSizeChangeFcn
tcl.GridSizeChangedFcn = @(tclObj,event)updateLegendLayout(tclObj,event,legh);
updateLegendLayout(tcl,[],legh);
% Manually resize the vertical and horizontal dimensions of the figure
function updateLegendLayout(tclObj,~,legh)
% Evoked when the TiledChartLayout grid size changes in flow arrangements.
% tclObj - TiledChartLayout object
% event - (unused in this demo) contains old and new grid size
% legh - legend handle
if isgraphics(legh,'legend')
if tclObj.GridSize(1) > tclObj.GridSize(2)
legh.Layout.Tile = "south";
legh.Orientation = "horizontal";
else
legh.Layout.Tile = "east";
legh.Orientation = "vertical";
end
end
end
Give it a shot in MATLAB R2022b
- Replace the legend with a colorbar to update the location and orientation of the colorbar.
- Define a GridSizeChangedFcn within the loop so that it is called every time a tile is added.
- Create a figure with many tiles (~20) and dynamically set a color to each row of axes.
- Assign xlabels only to the bottom row of tiles and ylabels to only the left column of tiles.
Learn about other new features
This article is attached as a live script.
Simulink is a block diagram environment used to design systems with multidomain models, simulate before moving to hardware, and deploy without writing code. In this livestream, Sam and Nishan will build up the basics of getting started using Simulink to build models.
Sign up here to get notification when it start streaming at 11:00 am (EDT) on Oct 13 view your timezone
Just in case, I have my license of MATLAB. I just have this question and I didn't find any information. I wouldn't like to create another account, for this reason I prefer to ask here.
Uniform spacing and the problem of round-off error
The vector [3 4 5 6 7 8 9] is uniformly spaced with a step size of 1. So is [3 2 1 0 -1 -2] but with a step size of -1.
The vector [1 2 4 8] is not uniformly spaced.
A vector v with uniform spacing has the same finite interval or step size between consecutive elements of the vector. But sometimes round-off error poses a problem in calculating uniformity.
Take, for example, the vector produced by
format shortg
v = linspace(1,9,7)
v = 1x7
1 2.3333 3.6667 5 6.3333 7.6667 9
Linspace produces linearly spaced vectors but the intervals between elements of v, computed by diff(v), are not identical.
dv = diff(v)
dv = 1x6
1.3333 1.3333 1.3333 1.3333 1.3333 1.3333
dv == dv(1)
ans = 1×6 logical array
1 0 0 1 0 1
diff(dv)
ans = 1x5
4.4409e-16 0 -4.4409e-16 8.8818e-16 -8.8818e-16
Some extra steps are therefore necessary to set a tolerance that ignores error introduced by floating point arithmetic.
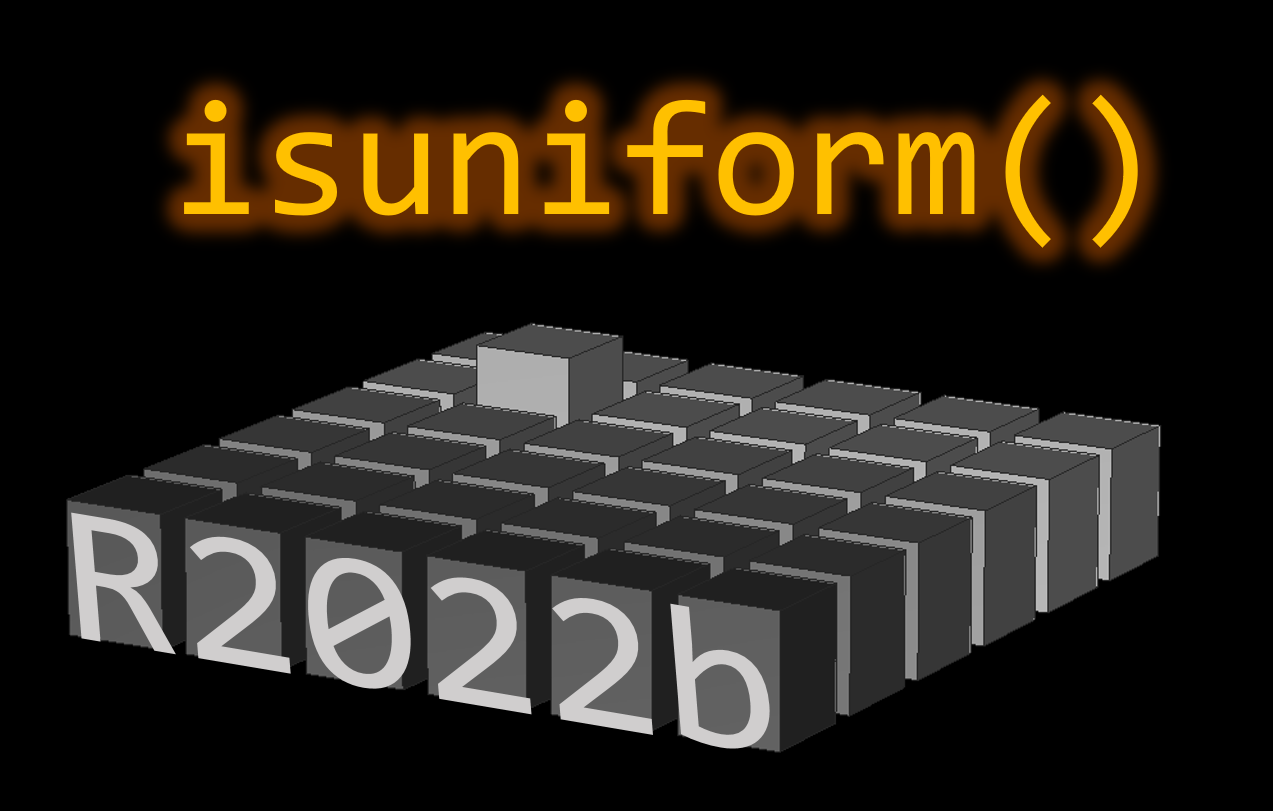
New in R2022b: isuniform
Determining uniformity of a vector became a whole lot easier in MATLAB R2022b with the new isuniform function.
isuniform returns a logical scalar indicating whether vector v is uniformly spaced within a round-off tolerance and returns the step size (or NaN if v is not uniform).
Let's look at the results for our vector v,
[tf,step] = isuniform(v)
tf = logical
1
step =
1.3333
How about non-uniformly spaced vector?
[tf,step] = isuniform(logspace(1,5,4))
tf = logical
0
step =
NaN
Give it a shot in MATLAB R2022b
- What happens when all elements of v are equal?
- Can you produce a vector with uniform spacing without using colons or linspace?
- What additional steps would be needed to use isuniform with circular data?
References
- isuniform - documentation
- Floating point numbers - documentation
- Floating point numbers - Cleve's Corner (blog)
This article is attached as a live script.
Always or usually. They're fun.
18%
Sometimes, some of them.
7%
Not yet, but probably will some day
25%
Never, and don't plan to.
50%
3937 个投票
We are thrilled to share that more than 400,000 people have subscribed to MATLAB YouTube channel to watch MATLAB and Simulink videos!🎉🙌🥳🎉🙌🥳🎉🙌🥳
The channel started way back in 2006, only one year after YouTube launched. Since then, people have spent more than 2.3 million hours watching our videos. It took us 12 years to reach 100k subscribers, two more years to get to 200k subs, and only 2 years to double that and grow to 400,000!
Did you know that in 2021, there were almost 10 million views to our videos on YouTube?
Thank you again for supporting our community inside and outside MATLAB Central!
You are invited to enter 2 fun community contests: MATLAB Mini Hack 2022 and Cody 10th Anniversary. The contests are designed for you to have fun, win prizes, and sharpen MATLAB skills. Participants across all skill levels are welcome to join!
How to Play
1. MATLAB Mini Hack 2022 contest:
Use up to 280 characters of MATLAB code to generate an interesting image. Sounds challenging? You can still participate by simply voting for the images you love.
2. Cody 10th Anniversary contest:
Solve at least 1 Cody problem per day during the 4-week contest period. We will reward participants with the longest streak of days of problem-solving!
Prizes
You will have opportunities to win compelling prizes, including Amazon gift cards, MathWorks T-shirts, and virtual badges. We will give out both weekly prizes and grand prizes. Check out the rules & prize section on each contest page for details.

Interested in joining? Follow the contests!
Click the ‘Follow the contests’ button to follow/register for the contest. You will get notified when the contests start. After contests start, you will also receive important announcements and prize information.

Grace Hopper Celebration is an event that celebrates the legacy of Grace Hopper who acted as the inspiration for generations of women in tech. My female coworkers in highly accomplished technical roles will be speaking at the event. Come meet, connect and network with them at GHC22.
Congratulations, Walter, for this amazing run!
You hit 100k points on 14th Aug, 2020. So, these 25k points took just over 2 years to earn.
Thank you for your contribution to the community!
MATLAB Central Team
If you are interested in developing algorithms for robotics and autonomous systems using ROS, there is an upcoming livestream just for you.
In this livestream, Jose Avendano Arbelaez and Ronal George will show you how to build and deploy autonomous algorithms using ROS. Using examples, they will show how to interface with ROS networks using publishers and subscribers, build algorithms for mapping, planning and navigation and deploying algorithms as ROS nodes.
Sign up here to get notification when it start streaming at 11:00 am (EDT) on Sep 1 view in your timezone
Congratulations, @Karim for winning the 1st ever Editor's Pick badge awarded for MATLAB Answers, in recoginition of your awesome solution in How to find X and Y coordinates of maximum gap between curves?
This is a new badge we just introduced to recognize awesome answers people contribute and yours was picked for discovering a creative way to solve the problem, and made the solution clear, and reproducible. Thank you so much for setting a high standard for MATLAB Answers and for your ongoing contribution to the community.
MATLAB Central Team
You provided 9717 answers at the acceptance rate of 75.23% and received 3281 votes. Thank you for your contribution to the community!
MATLAB Central Team
Watch live as Brandon Armstrong and Cris LaPierre import, visualize, and compute statistics without writing code in MATLAB.
The first challenge when starting a new project is importing and exploring the data to determine what it contains. This is especially true if your files contain a mix of numeric, text, and categorical data.
MATLAB has many new tools to simplify this process. Using app-based workflows enable you to spend more time investigating and exploring your data and less time troubleshooting code. Importantly, the code required to repeat your analysis is auto-generated so you can apply the same steps to new files and have others reproduce your work.
In MATLAB Answers, oftentimes we see good comments that provide solutions in a question thread. Those comments should really be answers. On the other hand, there are some answers that do not offer solutions. Those answers should actually be comments. The answer/comment issue makes it harder for readers of a question thread to quickly identify useful information. To tackle this issue, the community team just released the MOVE feature!
What can be moved?
Answers and comments can now be moved in 4 ways within the same question thread:
- Change an answer to a comment
- Change an answer with comments to a group of comments
- Change a comment to an answer
- Move a comment
Who can move answers and comments?
New privileges have been awarded to contributors with 2000 reputation points or more. Privileged contributors will see move icons added in the list of actions available for answers and comments.

After an answer or comment is moved, an indication of the move will be displayed with the content.
As always, please let us know your thoughts by leaving a reply below.
Never, I don't typically share code
46%
Never, even when my code is shared
14%
Occasionally
15%
Sometimes
8%
More often than not
5%
Always or almost always
12%
8896 个投票
Leave your MATLAB computer at home
35%
Bring computer but don't use MATLAB
18%
Bring computer and use MATLAB
11%
Bring phone and use MATLAB online
3%
Use MATLAB on someone else's comput
1%
Vacation? What's that?
32%
18554 个投票
Join us on a upcoming live to learn about how the deep learning frameworks in MATLAB and Simulink can be used with TensorFlow and PyTorch to provide enhanced capabilities for building and training your Machine Learning model.
- Date: 7/14 at 11am
- Link: https://youtu.be/ViI01KNIMh4
Watch this preview to learn more. https://youtu.be/ZPQgcFPCFZM
MATLAB (& Mathworks toolboxes) only
50%
Simulink only
2%
Both MATLAB & Simulink
22%
MATLAB & third party toolboxes
6%
Simulink & third party toolboxes
1%
Both ML & SL & 3rd party toolboxes
19%
1043 个投票
您也可以从以下列表中选择网站:
美洲
- América Latina (Español)
- Canada (English)
- United States (English)
欧洲
- Belgium (English)
- Denmark (English)
- Deutschland (Deutsch)
- España (Español)
- Finland (English)
- France (Français)
- Ireland (English)
- Italia (Italiano)
- Luxembourg (English)
- Netherlands (English)
- Norway (English)
- Österreich (Deutsch)
- Portugal (English)
- Sweden (English)
- Switzerland
- United Kingdom(English)
亚太
- Australia (English)
- India (English)
- New Zealand (English)
- 中国
- 日本Japanese (日本語)
- 한국Korean (한국어)