搜索
What is a rough number? What can they be used for? Today I'll take you down a journey into the land of prime numbers (in MATLAB). But remember that a journey is not always about your destination, but about what you learn along the way. And so, while this will be all about primes, and specifically large primes, before we get there we need some background. That will start with rough numbers.
Rough numbers are what I would describe as wannabe primes. Almost primes, and even sometimes prime, but often not prime. They could've been prime, but may not quite make it to the top. (If you are thinking of Marlon Brando here, telling us he "could've been a contender", you are on the right track.)
Mathematically, we could call a number k-rough if it is evenly divisible by no prime smaller than k. (Some authors will use the term k-rough to denote a number where the smallest prime factor is GREATER than k. The difference here is a minor one, and inconsequential for my purposes.) And there are also smooth numbers, numerical antagonists to the rough ones, those numbers with only small prime factors. They are not relevant to the topic today, even though smooth numbers are terribly valuable tools in mathematics. Please forward my apologies to the smooth numbers.
Have you seen rough numbers in use before? Probably so, at least if you ever learned about the sieve of Eratosthenes for prime numbers, though probably the concept of roughness was never explicitly discussed at the time. The sieve is simple. Suppose you wanted a list of all primes less than 100? (Without using the primes function itself.)
% simple sieve of Eratosthenes
Nmax = 100;
N = true(1,Nmax); % A boolean vector which when done, will indicate primes
N(1) = false; % 1 is not a prime by definition
nextP = find(N,1,'first'); % the first prime is 2
while nextP <= sqrt(Nmax)
% flag multiples of nextP as not prime
N(nextP*nextP:nextP:end) = false;
% find the first element after nextP that remains true
nextP = nextP + find(N(nextP+1:end),1,'first');
end
primeList = find(N)
Indeed, that is the set of all 25 primes not exceeding 100. If you think about how the sieve worked, it first found 2 is prime. Then it discarded all integer multiples of 2. The first element after 2 that remains as true is 3. 3 is of course the second prime. At each pass through the loop, the true elements that remain correspond to numbers which are becoming more and more rough. By the time we have eliminated all multiples of 2, 3, 5, and finally 7, everything else that remains below 100 must be prime! The next prime on the list we would find is 11, but we have already removed all multiples of 11 that do not exceed 100, since 11^2=121. For example, 77 is 11*7, but we already removed it, because 77 is a multiple of 7.
Such a simple sieve to find primes is great for small primes. However is not remotely useful in terms of finding primes with many thousands or even millions of decimal digits. And that is where I want to go, eventually. So how might we use roughness in a useful way? You can think of roughness as a way to increase the relative density of primes. That is, all primes are rough numbers. In fact, they are maximally rough. But not all rough numbers are primes. We might think of roughness as a necessary, but not sufficient condition to be prime.
How many primes lie in the interval [1e6,2e6]?
numel(primes(2e6)) - numel(primes(1e6))
There are 70435 primes greater than 1e6, but less than 2e6. Given there are 1 million natural numbers in that set, roughly 7% of those numbers were prime. Next, how many 100-rough numbers lie in that same interval?
N = (1e6:2e6)';
roughInd = all(mod(N,primes(100)) > 0,2);
sum(roughInd)
That is, there are 120571 100-rough numbers in that interval, but all those 70435 primes form a subset of the 100-rough numbers. What does this tell us? Of the 1 million numbers in that interval, approximately 12% of them were 100-rough, but 58% of the rough set were prime.
The point being, if we can efficiently identify a number as being rough, then we can substantially increase the chance it is also prime. Roughness in this sense is a prime densifier. (Is that even a word? It is now.) If we can reduce the number of times we need to perform an explicit isprime test, that will gain greatly because a direct test for primality is often quite costly in CPU time, at least on really large numbers.
In my next post, I'll show some ways we can employ rough numbers to look for some large primes.
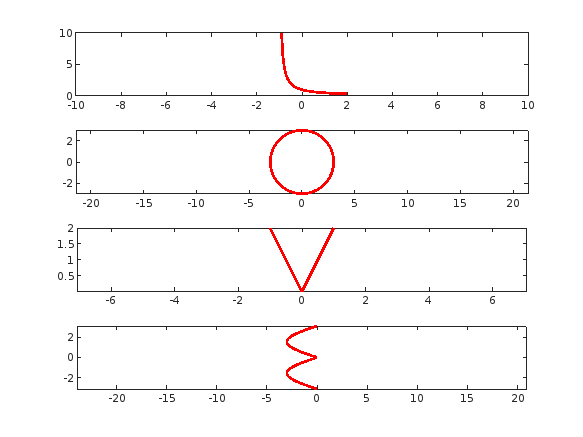
tiledlayout(4,1);
% Plot "L" (y = 1/(x+1), for x > -1)
x = linspace(-0.9, 2, 100); % Avoid x = -1 (undefined)
y =1 ./ (x+1) ;
nexttile;
plot(x, y, 'r', 'LineWidth', 2);
xlim([-10,10])
% Plot "O" (x^2 + y^2 = 9)
theta = linspace(0, 2*pi, 100);
x = 3 * cos(theta);
y = 3 * sin(theta);
nexttile;
plot(x, y, 'r', 'LineWidth', 2);
axis equal;
% Plot "V" (y = -2|x|)
x = linspace(-1, 1, 100);
y = 2 * abs(x);
nexttile;
plot(x, y, 'r', 'LineWidth', 2);
axis equal;
% Plot "E" (x = -3 |sin(y)|)
y = linspace(-pi, pi, 100);
x = -3 * abs(sin(y));
nexttile;
plot(x, y, 'r', 'LineWidth', 2);
axis equal;
I've been trying this problem a lot of time and i don't understand why my solution doesnt't work.
In 4 tests i get the error Assertion failed but when i run the code myself i get the diag and antidiag correctly.
function [diag_elements, antidg_elements] = your_fcn_name(x)
[m, n] = size(x);
% Inicializar los vectores de la diagonal y la anti-diagonal
diag_elements = zeros(1, min(m, n));
antidg_elements = zeros(1, min(m, n));
% Extraer los elementos de la diagonal
for i = 1:min(m, n)
diag_elements(i) = x(i, i);
end
% Extraer los elementos de la anti-diagonal
for i = 1:min(m, n)
antidg_elements(i) = x(m-i+1, i);
end
end
Check out the result of "emoji matrix" multiplication below.
- vector multiply vector:
a = ["😁","😁","😁"]
b = ["😂";
"😂"
"😂"]
c = a*b
d = b*a
- matrix multiply matrix:
matrix1 = [
"😀", "😃";
"😄", "😁"]
matrix2 = [
"😆", "😅";
"😂", "🤣"]
resutl = matrix1*matrix2
enjoy yourself!
For Valentine's day this year I tried to do something a little more than just the usual 'Here's some MATLAB code that draws a picture of a heart' and focus on how to share MATLAB code. TL;DR, here's my advice
- Put the code on GitHub. (Allows people to access and collaborate on your code)
- Set up 'Open in MATLAB Online' in your GitHub repo (Allows people to easily run it)
I used code by @Zhaoxu Liu / slandarer and others to demonstrate. I think that those two steps are the most impactful in that they get you from zero to one but If I were to offer some more advice for research code it would be
3. Connect the GitHub repo to File Exchange (Allows MATLAB users to easily find it in-product).
4. Get a Digitial Object Identifier (DOI) using something like Zenodo. (Allows people to more easily cite your code)
There is still a lot more you can do of course but if everyone did this for any MATLAB code relating to a research paper, we'd be in a better place I think.
Here's the article: On love and research software: Sharing code with your Valentine » The MATLAB Blog - MATLAB & Simulink
What do you think?
Simulink has been an essential tool for modeling and simulating dynamic systems in MATLAB. With the continuous advancements in AI, automation, and real-time simulation, I’m curious about what the future holds for Simulink.
What improvements or new features do you think Simulink will have in the coming years? Will AI-driven modeling, cloud-based simulation, or improved hardware integration shape the next generation of Simulink?
I got thoroughly nerd-sniped by this xkcd, leading me to wonder if you can use MATLAB to figure out the dice roll for any given (rational) probability. Well, obviously you can. The question is how. Answer: lots of permutation calculations and convolutions.
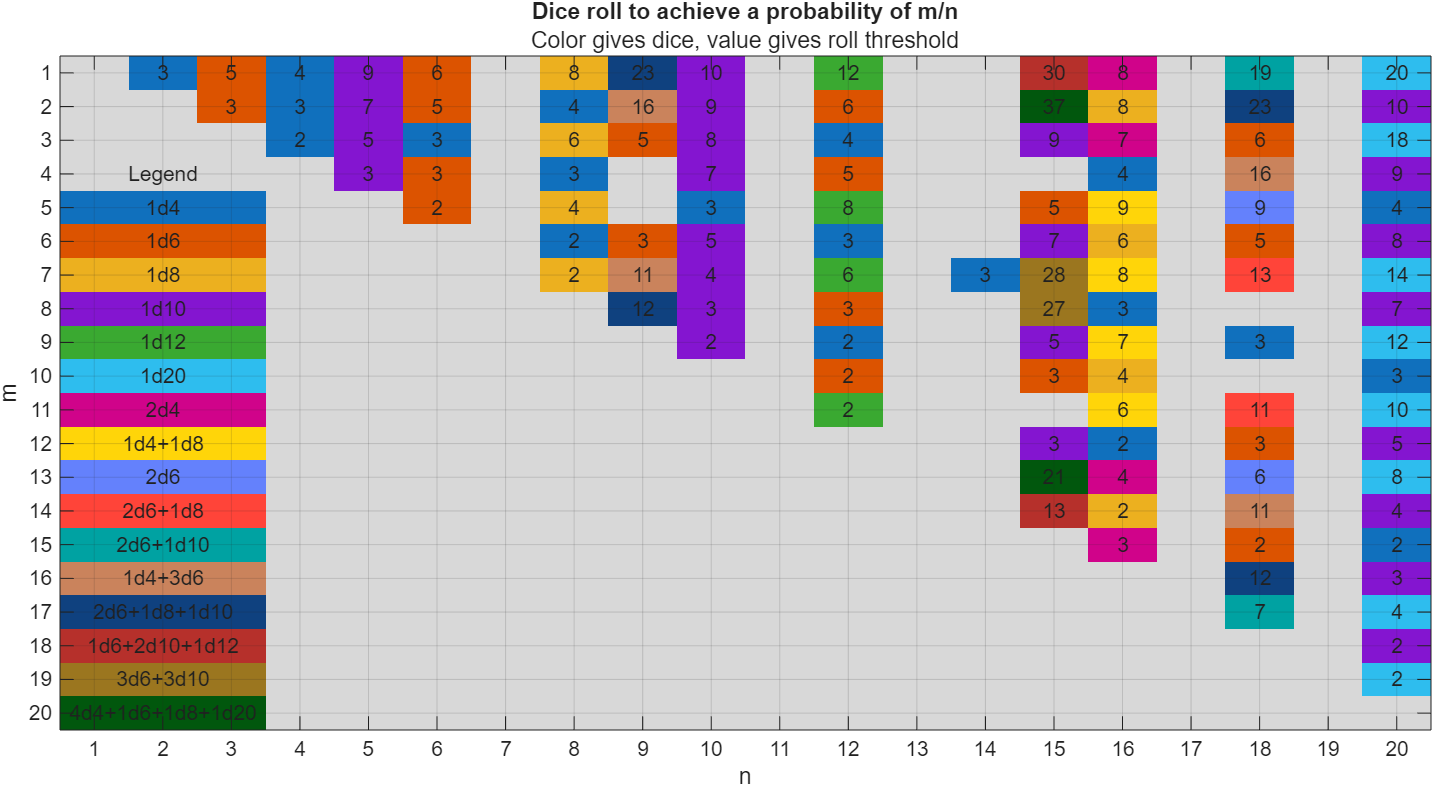
In the original xkcd, the situation described by the player has a probability of 2/9. Looking up the plot, row 2 column 9, shows that you need 16 or greater on (from the legend) 1d4+3d6, just as claimed.
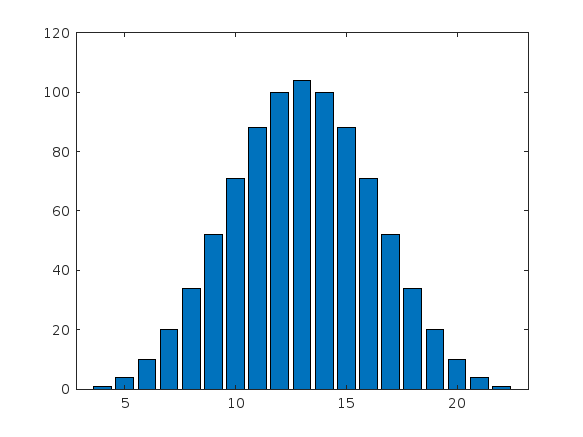
If you missed the bit about convolutions, this is a super-neat trick
[v,c] = dicedist([4 6 6 6]);
bar(v,c)
% Probability distribution of dice given by d
function [vals,counts] = dicedist(d)
% d is a vector of number of sides
n = numel(d); % number of dice
% Use convolution to count the number of ways to get each roll value
counts = 1;
for k = 1:n
counts = conv(counts,ones(1,d(k)));
end
% Possible values range from n to sum(d)
maxtot = sum(d);
vals = n:maxtot;
end
MATLAB FEX(MATLAB File Exchange) should support Markdown syntax for writing. In recent years, many open-source community documentation platforms, such as GitHub, have generally supported Markdown. MATLAB is also gradually improving its support for Markdown syntax. However, when directly uploading files to the MATLAB FEX community and preparing to write an overview, the outdated document format buttons are still present. Even when directly uploading a Markdown document, it cannot be rendered. We hope the community can support Markdown syntax!
BTW,I know that open-source Markdown writing on GitHub and linking to MATLAB FEX is feasible, but this is a workaround. It would be even better if direct native support were available.
You've probably heard about the DeepSeek AI models by now. Did you know you can run them on your own machine (assuming its powerful enough) and interact with them on MATLAB?
In my latest blog post, I install and run one of the smaller models and start playing with it using MATLAB.
Larger models wouldn't be any different to use assuming you have a big enough machine...and for the largest models you'll need a HUGE machine!
Even tiny models, like the 1.5 billion parameter one I demonstrate in the blog post, can be used to demonstrate and teach things about LLM-based technologies.
Have a play. Let me know what you think.
My following code works running Matlab 2024b for all test cases. However, 3 of 7 tests fail (#1, #4, & #5) the QWERTY Shift Encoder problem. Any ideas what I am missing?
Thanks in advance.
keyboardMap1 = {'qwertyuiop[;'; 'asdfghjkl;'; 'zxcvbnm,'};
keyboardMap2 = {'QWERTYUIOP{'; 'ASDFGHJKL:'; 'ZXCVBNM<'};
if length(s) == 0
se = s;
end
for i = 1:length(s)
if double(s(i)) >= 65 && s(i) <= 90
row = 1;
col = 1;
while ~strcmp(s(i), keyboardMap2{row}(col))
if col < length(keyboardMap2{row})
col = col + 1;
else
row = row + 1;
col = 1;
end
end
se(i) = keyboardMap2{row}(col + 1);
elseif double(s(i)) >= 97 && s(i) <= 122
row = 1;
col = 1;
while ~strcmp(s(i), keyboardMap1{row}(col))
if col < length(keyboardMap1{row})
col = col + 1;
else
row = row + 1;
col = 1;
end
end
se(i) = keyboardMap1{row}(col + 1);
else
se(i) = s(i);
end
% if ~(s(i) = 65 && s(i) <= 90) && ~(s(i) >= 97 && s(i) <= 122)
% se(i) = s(i);
% end
end
Too small
22%
Just right
38%
Too large
40%
2648 个投票
In one of my MATLAB projects, I want to add a button to an existing axes toolbar. The function for doing this is axtoolbarbtn:
axtoolbarbtn(tb,style,Name=Value)
However, I have found that the existing interfaces and behavior make it quite awkward to accomplish this task.
Here are my observations.
Adding a Button to the Default Axes Toolbar Is Unsupported
plot(1:10)
ax = gca;
tb = ax.Toolbar
Calling axtoolbarbtn on ax results in an error:
>> axtoolbarbtn(tb,"state")
Error using axtoolbarbtn (line 77)
Modifying the default axes toolbar is not supported.
Default Axes Toolbar Can't Be Distinguished from an Empty Toolbar
The Children property of the default axes toolbar is empty. Thus, it appears programmatically to have no buttons, just like an empty toolbar created by axtoolbar.
cla
plot(1:10)
ax = gca;
tb = ax.Toolbar;
tb.Children
ans = 0x0 empty GraphicsPlaceholder array.
tb2 = axtoolbar(ax);
tb2.Children
ans = 0x0 empty GraphicsPlaceholder array.
A Workaround
An empty axes toolbar seems to have no use except to initalize a toolbar before immediately adding buttons to it. Therefore, it seems reasonable to assume that an axes toolbar that appears to be empty is really the default toolbar. While we can't add buttons to the default axes toolbar, we can create a new toolbar that has all the same buttons as the default one, using axtoolbar("default"). And then we can add buttons to the new toolbar.
That observation leads to this workaround:
tb = ax.Toolbar;
if isempty(tb.Children)
% Assume tb is the default axes toolbar. Recreate
% it with the default buttons so that we can add a new
% button.
tb = axtoolbar(ax,"default");
end
btn = axtoolbarbtn(tb);
% Then set up the button as desired (icon, callback,
% etc.) by setting its properties.
As workarounds go, it's not horrible. It just seems a shame to have to delete and then recreate a toolbar just to be able to add a button to it.
The worst part about the workaround is that it is so not obvious. It took me a long time of experimentation to figure it out, including briefly giving it up as seemingly impossible.
The documentation for axtoolbarbtn avoids the issue. The most obvious example to write for axtoolbarbtn would be the first thing every user of it will try: add a toolbar button to the toolbar that gets created automatically in every call to plot. The doc page doesn't include that example, of course, because it wouldn't work.
My Request
I like the axes toolbar concept and the axes interactivity that it promotes, and I think the programming interface design is mostly effective. My request to MathWorks is to modify this interface to smooth out the behavior discontinuity of the default axes toolbar, with an eye towards satisfying (and documenting) the general use case that I've described here.
One possible function design solution is to make the default axes toolbar look and behave like the toolbar created by axtoolbar("default"), so that it has Children and so it is modifiable.
I am curious as to how my goal can be accomplished in Matlab.
The present APP called "Matching Network Designer" works quite well, but it is limited to a single section of a "PI", a "TEE", or an "L" topology circuit.
This limits the bandwidth capability of the APP when the intended use is to create an amplifier design intended for wider bandwidth projects.
I am requesting that a "Broadband Matching Network Designer" APP be developed by you, the MathWorks support team.
One suggestion from me is to be able to cascade a second section (or "pole") to the first.
Then the resulting topology would be capable of achieving that wider bandwidth of the microwave amplifier project where it would be later used with the transistor output and input matching networks.
Instead of limiting the APP to a single frequency, the entire s parameter file would be used as an input.
The APP would convert the polar s parameters to rectangular scaler complex impedances that you already use.
At that point, having started out with the first initial center frequency, the other frequencies both greater than and less than the center would come into use by an optimization of the circuit elements.
I'm hoping that you will be able to take on this project.
I can include an attachment of such a Matching Network Designer APP that you presently have if you like.
That network is centered at 10 GHz.
Kimberly Renee Alvarez.
310-367-5768
Hello,
Now that the "Copilot+PC" (Windows ARM) laptops are rapidly increasing in market share (Microsoft Surface Laptop, Dell XPS 13, HP OmniBook X 14, and more), are there any plans to provide builds for Matlab on Windows arm64?
Since there are already Windows builds of Matlab, it shouldn't be too hard to compile for Windows arm64, as far as I know. But I am not famaliar with Matlab's codebase.
Please try to publish Windows arm64 builds soon so that Matlab can be much more usable on Windows on ARM as it will run natively instead of in emulation.
Thank you very much.
Attaching the Photoshop file if you want to modify the caption.
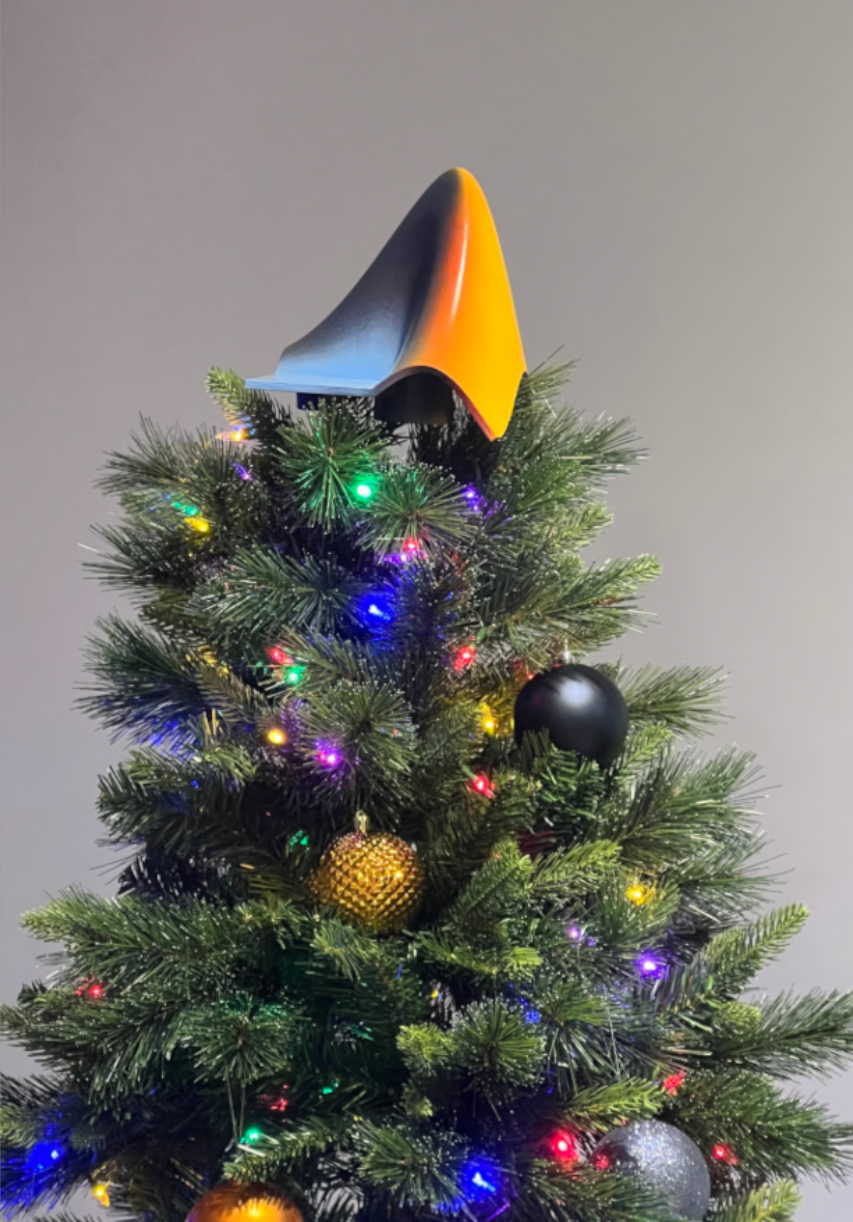
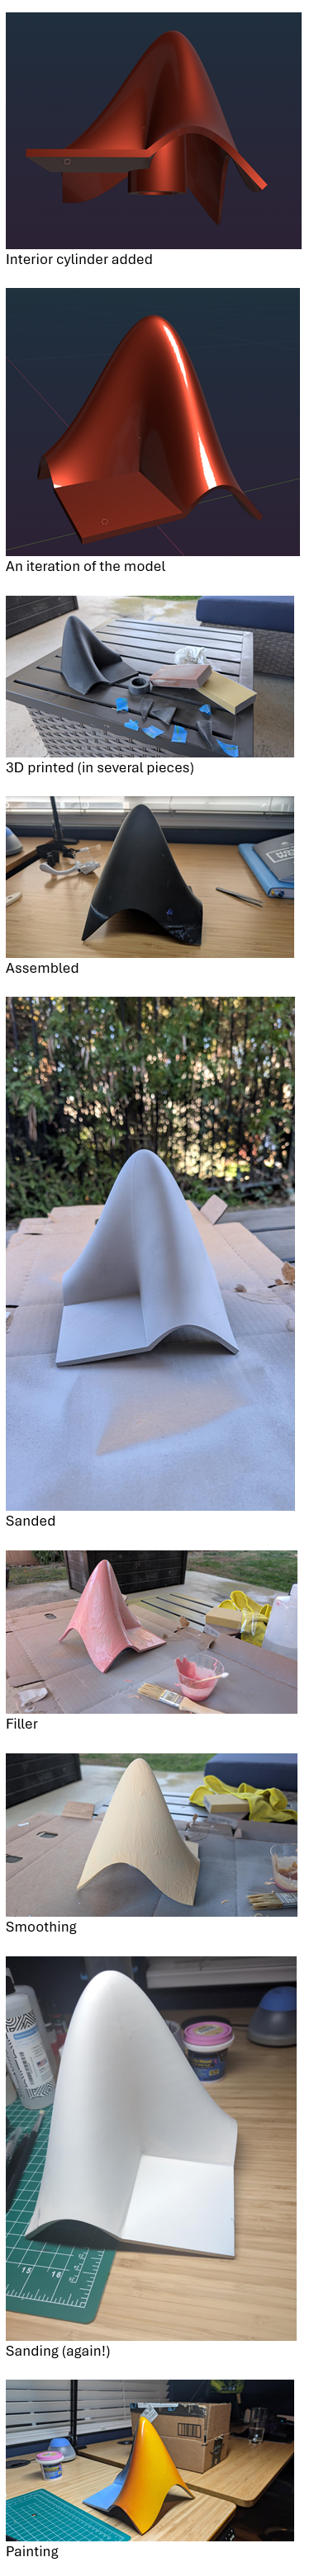
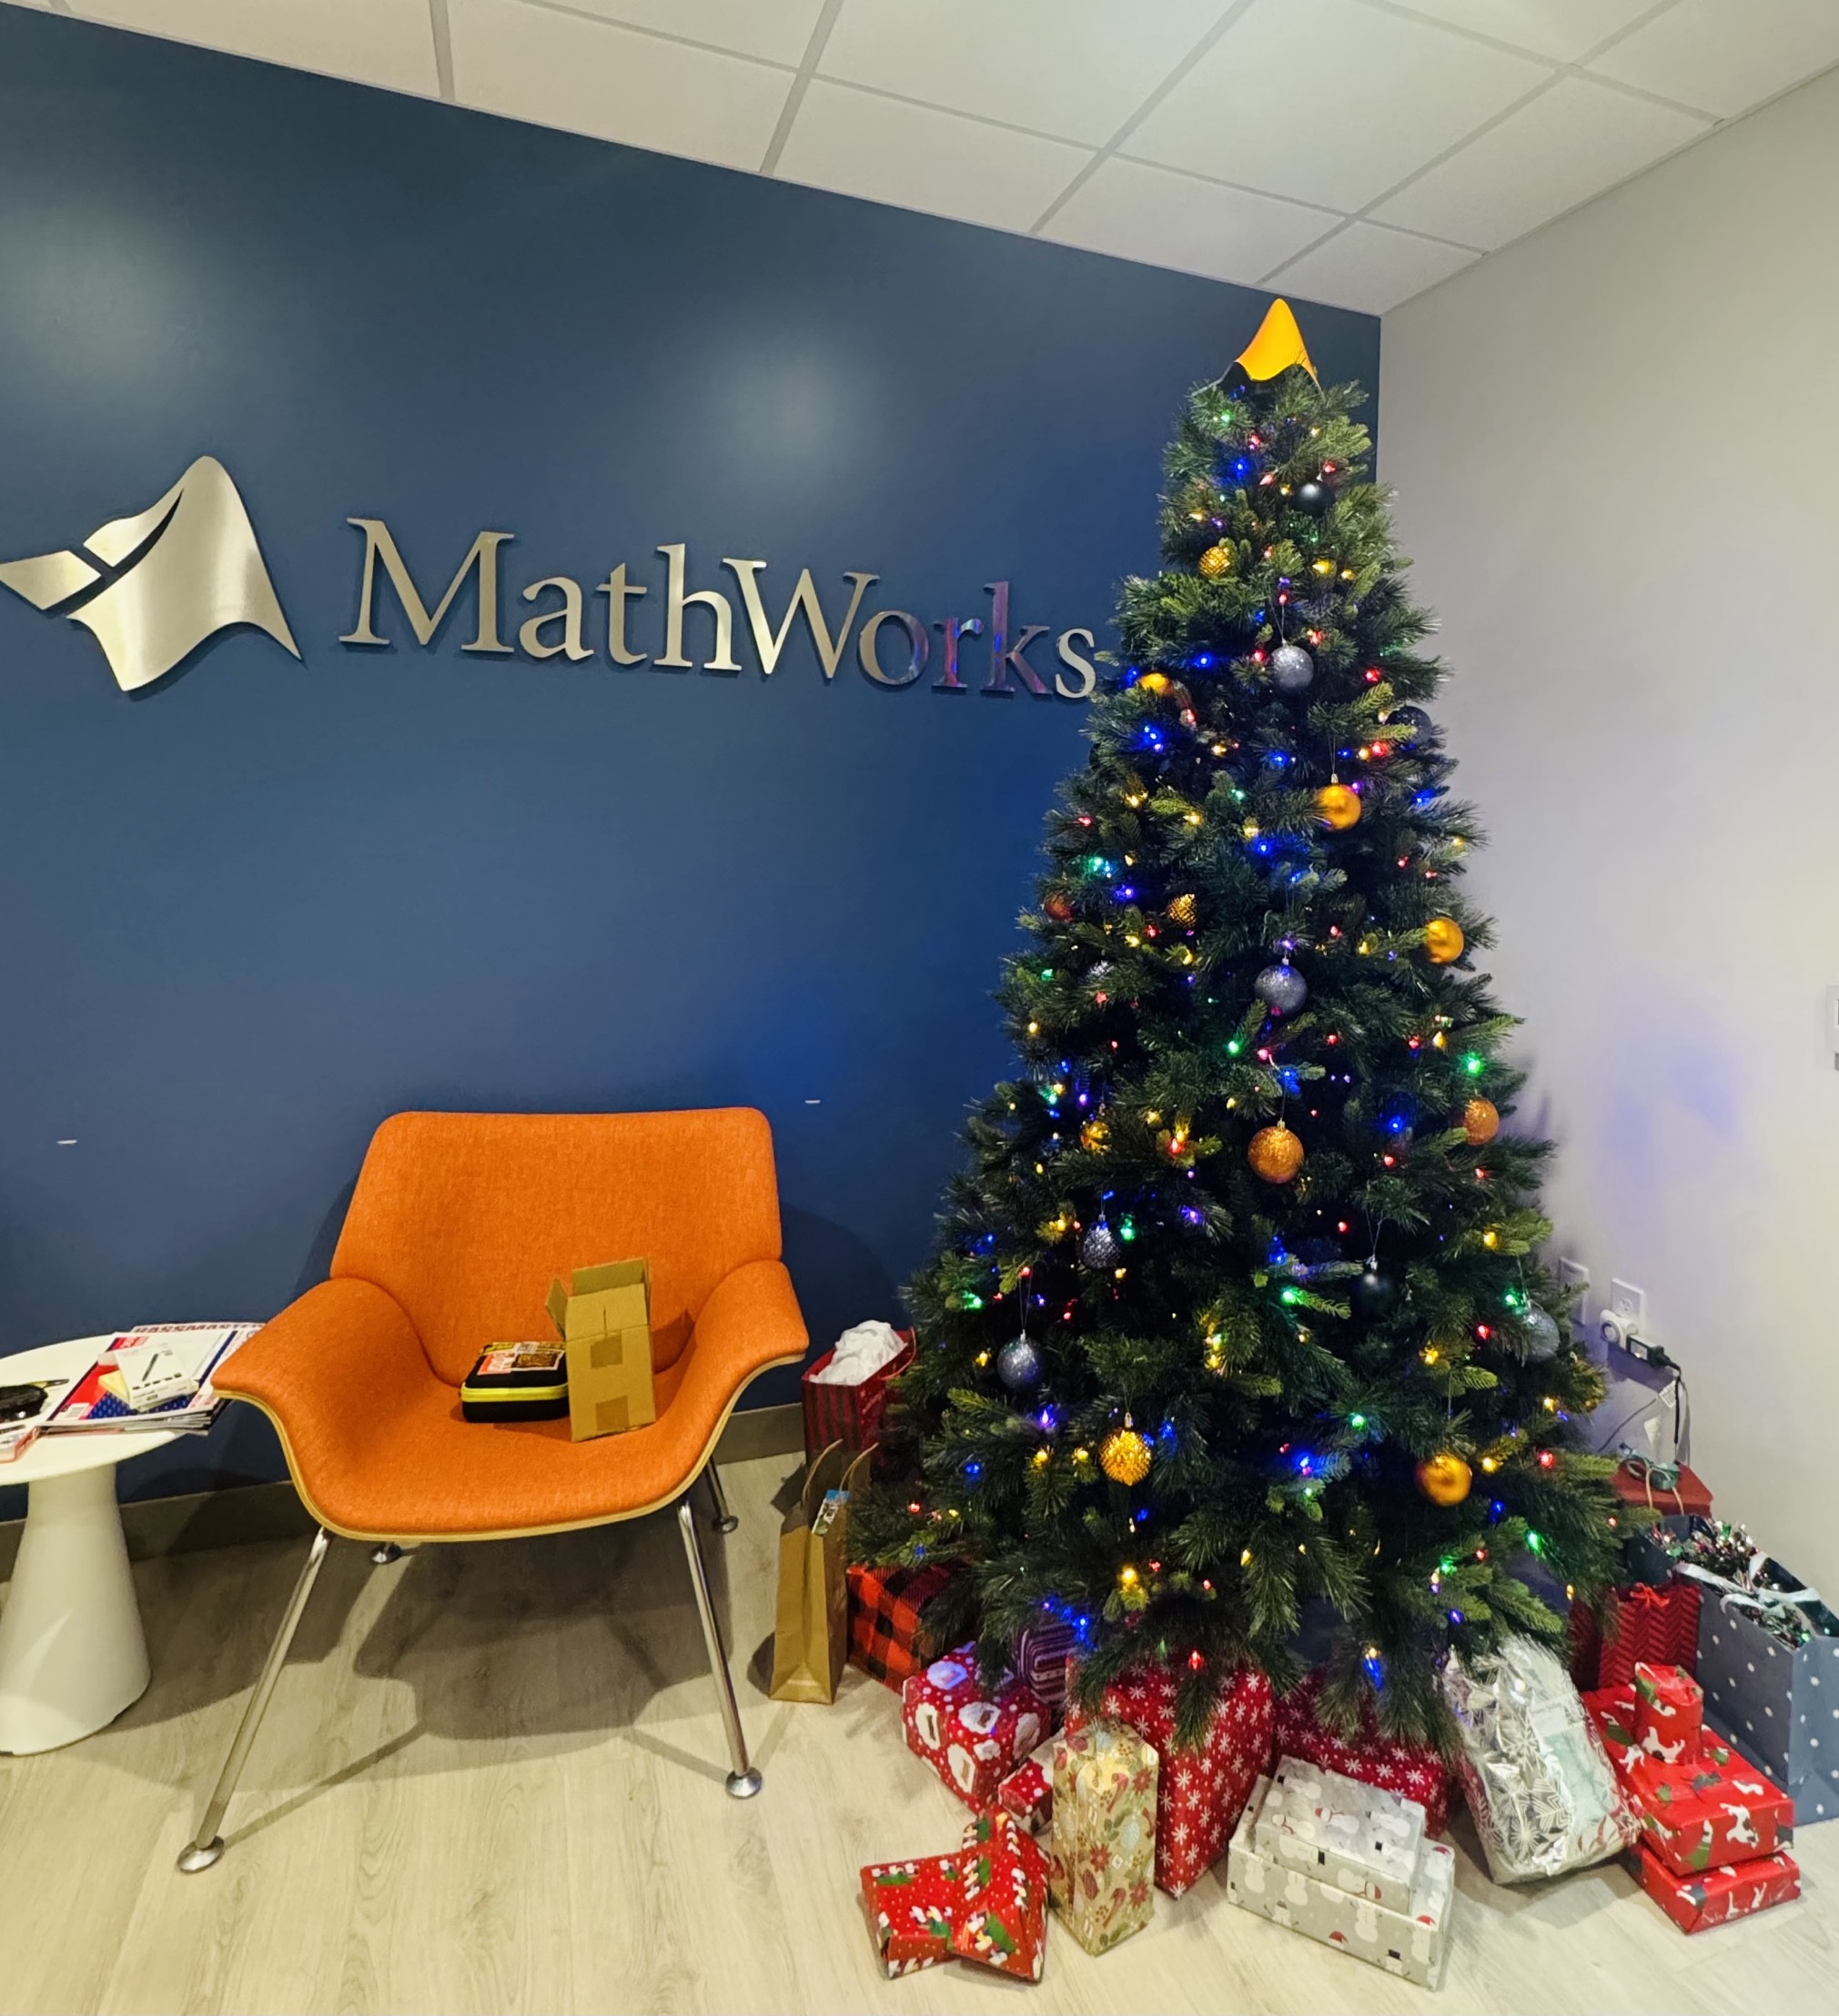
What better way to add a little holiday magic than the L-shaped membrane atop your evergreen? My colleagues output the shape and then added some thickness and an interior cylinder in Blender. Then, the shape was exported to STL and 3D printed (in several pieces). Then glued, sanded, primed, sanded again and painted. If you like, the STL file is attached. Thank you to https://blogs.mathworks.com/community/2013/06/20/paul-prints-the-l-shaped-membrane/ and a tip of the hat to MATLAB Ornament. Happy Holidays!
If you have a folder with an enormous number of files and want to use the uigetfile function to select specific files, you may have noticed a significant delay in displaying the file list.
Thanks to the assistance from MathWorks support, an interesting behavior was observed.
For example, if a folder such as Z:\Folder1\Folder2\data contains approximately 2 million files, and you attempt to use uigetfile to access files with a specific extension (e.g., *.ext), the following behavior occurs:
Method 1: This takes minutes to show me the list of all files
[FileName, PathName] = uigetfile('Z:\Folder1\Folder2\data\*.ext', 'File selection');
Method 2: This takes less than a second to display all files.
[FileName, PathName] = uigetfile('*.ext', 'File selection','Z:\Folder1\Folder2\data');
Method 3: This method also takes minutes to display the file list. What is intertesting is that this method is the same as Method 2, except that a file seperator "\" is added at the end of the folder string.
[FileName, PathName] = uigetfile('*.ext', 'File selection','Z:\Folder1\Folder2\data\');
I was informed that the Mathworks development team has been informed of this strange behaviour.
I am using 2023a, but think this should be the same for newer versions.
This post is more of a "tips and tricks" guide than a question.
If you have a folder with an enormous number of files and want to use the uigetfile function to select specific files, you may have noticed a significant delay in displaying the file list.
Thanks to the assistance from MathWorks support, an interesting behavior was observed.
For example, if a folder such as Z:\Folder1\Folder2\data contains approximately 2 million files, and you attempt to use uigetfile to access files with a specific extension (e.g., *.ext), the following behavior occurs:
Method 1: This takes minutes to show me the list of all files
[FileName, PathName] = uigetfile('Z:\Folder1\Folder2\data\*.ext', 'File selection');
Method 2: This takes less than a second to display all files.
[FileName, PathName] = uigetfile('*.ext', 'File selection','Z:\Folder1\Folder2\data');
Method 3: This method also takes minutes to display the file list. What is intertesting is that this method is the same as Method 2, except that a file seperator "\" is added at the end of the folder string.
[FileName, PathName] = uigetfile('*.ext', 'File selection','Z:\Folder1\Folder2\data\');
I was informed that the Mathworks development team has been informed of this strange behaviour.
I am using 2023a, but think this should be the same for newer versions.
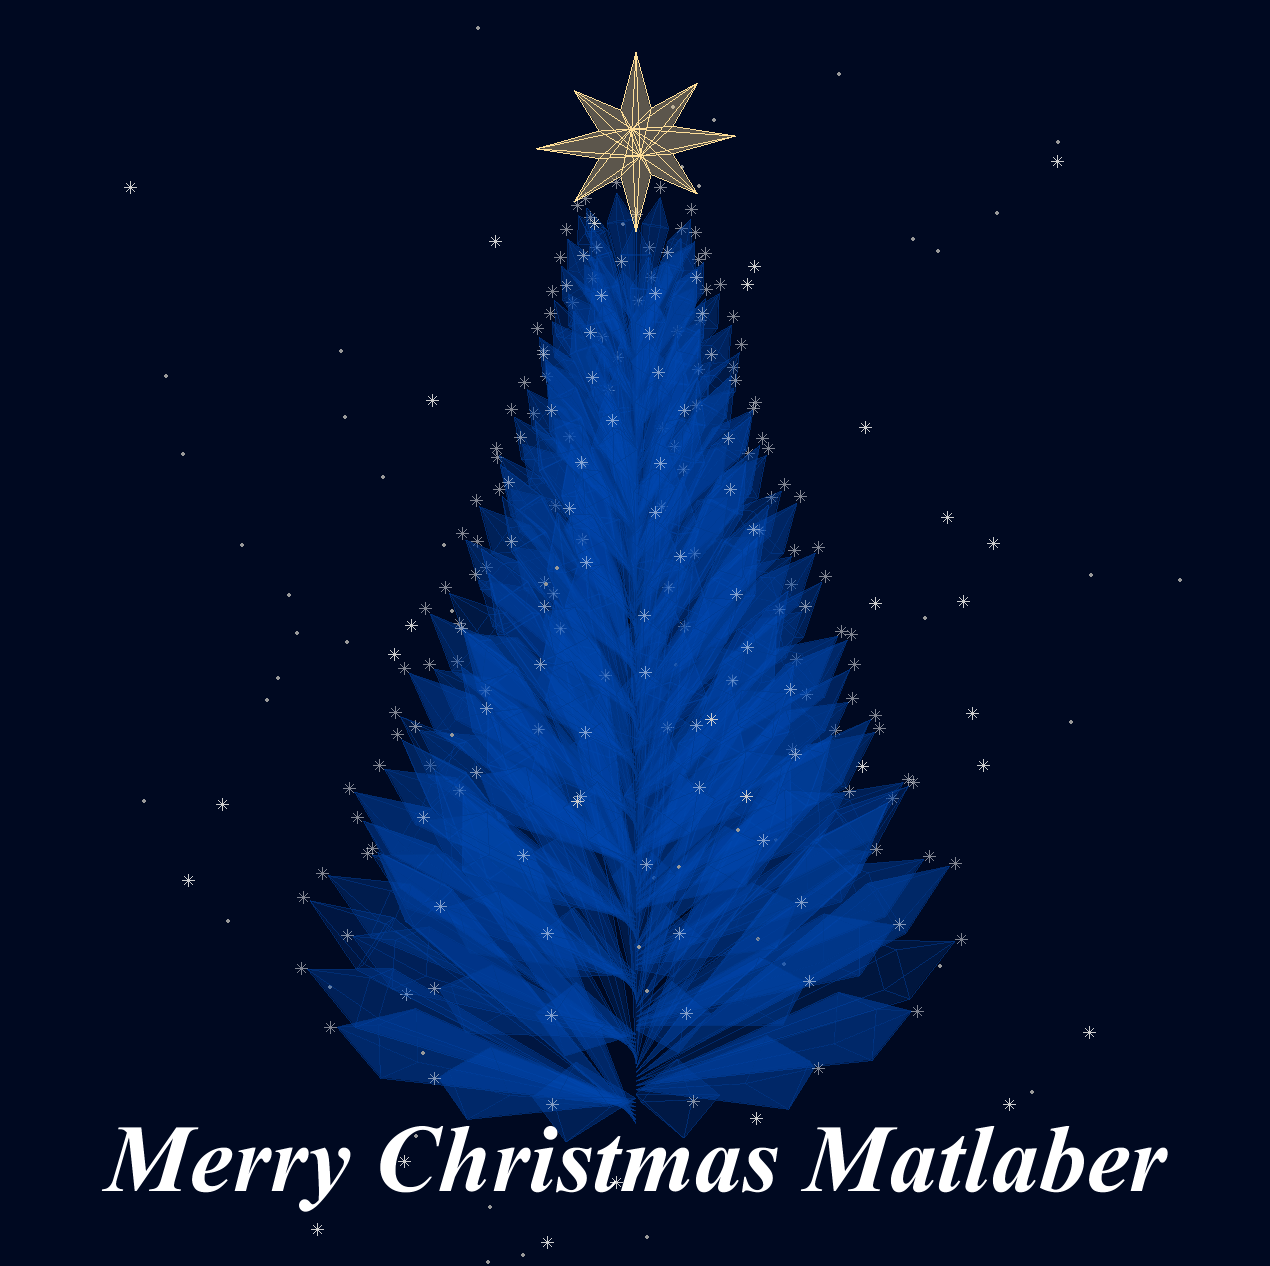
Christmas is coming, here are two dynamic Christmas tree drawing codes:
Crystal XMas Tree
function XmasTree2024_1
fig = figure('Units','normalized', 'Position',[.1,.1,.5,.8],...
'Color',[0,9,33]/255, 'UserData',40 + [60,65,75,72,0,59,64,57,74,0,63,59,57,0,1,6,45,75,61,74,28,57,76,57,1,1]);
axes('Parent',fig, 'Position',[0,-1/6,1,1+1/3], 'UserData',97 + [18,11,0,13,3,0,17,4,17],...
'XLim',[-1.5,1.5], 'YLim',[-1.5,1.5], 'ZLim',[-.2,3.8], 'DataAspectRatio', [1,1,1], 'NextPlot','add',...
'Projection','perspective', 'Color',[0,9,33]/255, 'XColor','none', 'YColor','none', 'ZColor','none')
%% Draw Christmas tree
F = [1,3,4;1,4,5;1,5,6;1,6,3;...
2,3,4;2,4,5;2,5,6;2,6,3];
dP = @(V) patch('Faces',F, 'Vertices',V, 'FaceColor',[0 71 177]./255,...
'FaceAlpha',rand(1).*0.2+0.1, 'EdgeColor',[0 71 177]./255.*0.8,...
'EdgeAlpha',0.6, 'LineWidth',0.5, 'EdgeLighting','gouraud', 'SpecularStrength',0.3);
r = .1; h = .8;
V0 = [0,0,0; 0,0,1; 0,r,h; r,0,h; 0,-r,h; -r,0,h];
% Rotation matrix
Rx = @(V, theta) V*[1 0 0; 0 cos(theta) sin(theta); 0 -sin(theta) cos(theta)];
Rz = @(V, theta) V*[cos(theta) sin(theta) 0;-sin(theta) cos(theta) 0; 0 0 1];
N = 180; Vn = zeros(N, 3); eval(char(fig.UserData))
for i = 1:N
tV = Rz(Rx(V0.*(1.2 - .8.*i./N + rand(1).*.1./i^(1/5)), pi/3.*(1 - .6.*i./N)), i.*pi/8.1 + .001.*i.^2) + [0,0,.016.*i];
dP(tV); Vn(i,:) = tV(2,:);
end
scatter3(Vn(:,1).*1.02,Vn(:,2).*1.02,Vn(:,3).*1.01, 30, 'w', 'Marker','*', 'MarkerEdgeAlpha',.5)
%% Draw Star of Bethlehem
w = .3; R = .62; r = .4; T = (1/8:1/8:(2 - 1/8)).'.*pi;
V8 = [ 0, 0, w; 0, 0,-w;
1, 0, 0; 0, 1, 0; -1, 0, 0; 0,-1,0;
R, R, 0; -R, R, 0; -R,-R, 0; R,-R,0;
cos(T).*r, sin(T).*r, T.*0];
F8 = [1,3,25; 1,3,11; 2,3,25; 2,3,11; 1,7,11; 1,7,13; 2,7,11; 2,7,13;
1,4,13; 1,4,15; 2,4,13; 2,4,15; 1,8,15; 1,8,17; 2,8,15; 2,8,17;
1,5,17; 1,5,19; 2,5,17; 2,5,19; 1,9,19; 1,9,21; 2,9,19; 2,9,21;
1,6,21; 1,6,23; 2,6,21; 2,6,23; 1,10,23; 1,10,25; 2,10,23; 2,10,25];
V8 = Rx(V8.*.3, pi/2) + [0,0,3.5];
patch('Faces',F8, 'Vertices',V8, 'FaceColor',[255,223,153]./255,...
'EdgeColor',[255,223,153]./255, 'FaceAlpha', .2)
%% Draw snow
sXYZ = rand(200,3).*[4,4,5] - [2,2,0];
sHdl1 = plot3(sXYZ(1:90,1),sXYZ(1:90,2),sXYZ(1:90,3), '*', 'Color',[.8,.8,.8]);
sHdl2 = plot3(sXYZ(91:200,1),sXYZ(91:200,2),sXYZ(91:200,3), '.', 'Color',[.6,.6,.6]);
annotation(fig,'textbox',[0,.05,1,.09], 'Color',[1 1 1], 'String','Merry Christmas Matlaber',...
'HorizontalAlignment','center', 'FontWeight','bold', 'FontSize',48,...
'FontName','Times New Roman', 'FontAngle','italic', 'FitBoxToText','off','EdgeColor','none');
% Rotate the Christmas tree and let the snow fall
for i=1:1e8
sXYZ(:,3) = sXYZ(:,3) - [.05.*ones(90,1); .06.*ones(110,1)];
sXYZ(sXYZ(:,3)<0, 3) = sXYZ(sXYZ(:,3) < 0, 3) + 5;
sHdl1.ZData = sXYZ(1:90,3); sHdl2.ZData = sXYZ(91:200,3);
view([i,30]); drawnow; pause(.05)
end
end
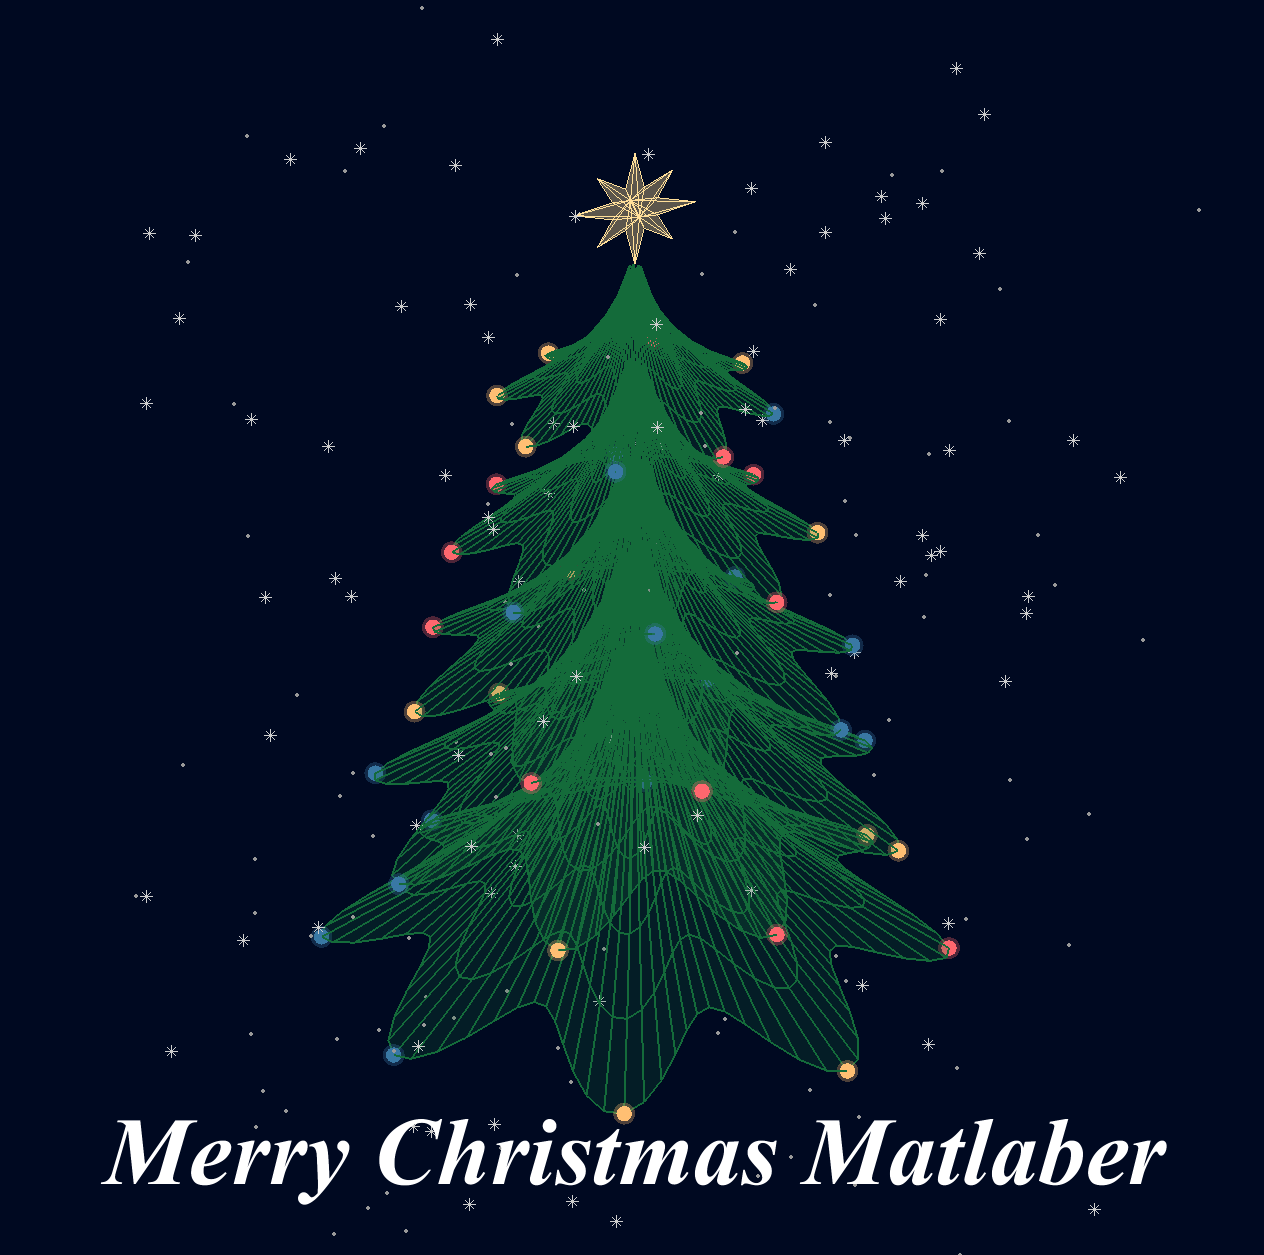
Curved XMas Tree
function XmasTree2024_2
fig = figure('Units','normalized', 'Position',[.1,.1,.5,.8],...
'Color',[0,9,33]/255, 'UserData',40 + [60,65,75,72,0,59,64,57,74,0,63,59,57,0,1,6,45,75,61,74,28,57,76,57,1,1]);
axes('Parent',fig, 'Position',[0,-1/6,1,1+1/3], 'UserData',97 + [18,11,0,13,3,0,17,4,17],...
'XLim',[-6,6], 'YLim',[-6,6], 'ZLim',[-16, 1], 'DataAspectRatio', [1,1,1], 'NextPlot','add',...
'Projection','perspective', 'Color',[0,9,33]/255, 'XColor','none', 'YColor','none', 'ZColor','none')
%% Draw Christmas tree
[X,T] = meshgrid(.4:.1:1, 0:pi/50:2*pi);
XM = 1 + sin(8.*T).*.05;
X = X.*XM; R = X.^(3).*(.5 + sin(8.*T).*.02);
dF = @(R, T, X) surf(R.*cos(T), R.*sin(T), -X, 'EdgeColor',[20,107,58]./255,...
'FaceColor', [20,107,58]./255, 'FaceAlpha',.2, 'LineWidth',1);
CList = [254,103,110; 255,191,115; 57,120,164]./255;
for i = 1:5
tR = R.*(2 + i); tT = T+i; tX = X.*(2 + i) + i;
SFHdl = dF(tR, tT, tX);
[~, ind] = sort(SFHdl.ZData(:)); ind = ind(1:8);
C = CList(randi([1,size(CList,1)], [8,1]), :);
scatter3(tR(ind).*cos(tT(ind)), tR(ind).*sin(tT(ind)), -tX(ind), 120, 'filled',...
'CData', C, 'MarkerEdgeColor','none', 'MarkerFaceAlpha',.3)
scatter3(tR(ind).*cos(tT(ind)), tR(ind).*sin(tT(ind)), -tX(ind), 60, 'filled', 'CData', C)
end
%% Draw Star of Bethlehem
Rx = @(V, theta) V*[1 0 0; 0 cos(theta) sin(theta); 0 -sin(theta) cos(theta)];
% Rz = @(V, theta) V*[cos(theta) sin(theta) 0;-sin(theta) cos(theta) 0; 0 0 1];
w = .3; R = .62; r = .4; T = (1/8:1/8:(2 - 1/8)).'.*pi;
V8 = [ 0, 0, w; 0, 0,-w;
1, 0, 0; 0, 1, 0; -1, 0, 0; 0,-1,0;
R, R, 0; -R, R, 0; -R,-R, 0; R,-R,0;
cos(T).*r, sin(T).*r, T.*0];
F8 = [1,3,25; 1,3,11; 2,3,25; 2,3,11; 1,7,11; 1,7,13; 2,7,11; 2,7,13;
1,4,13; 1,4,15; 2,4,13; 2,4,15; 1,8,15; 1,8,17; 2,8,15; 2,8,17;
1,5,17; 1,5,19; 2,5,17; 2,5,19; 1,9,19; 1,9,21; 2,9,19; 2,9,21;
1,6,21; 1,6,23; 2,6,21; 2,6,23; 1,10,23; 1,10,25; 2,10,23; 2,10,25];
V8 = Rx(V8.*.8, pi/2) + [0,0,-1.3];
patch('Faces',F8, 'Vertices',V8, 'FaceColor',[255,223,153]./255,...
'EdgeColor',[255,223,153]./255, 'FaceAlpha', .2)
annotation(fig,'textbox',[0,.05,1,.09], 'Color',[1 1 1], 'String','Merry Christmas Matlaber',...
'HorizontalAlignment','center', 'FontWeight','bold', 'FontSize',48,...
'FontName','Times New Roman', 'FontAngle','italic', 'FitBoxToText','off','EdgeColor','none');
%% Draw snow
sXYZ = rand(200,3).*[12,12,17] - [6,6,16];
sHdl1 = plot3(sXYZ(1:90,1),sXYZ(1:90,2),sXYZ(1:90,3), '*', 'Color',[.8,.8,.8]);
sHdl2 = plot3(sXYZ(91:200,1),sXYZ(91:200,2),sXYZ(91:200,3), '.', 'Color',[.6,.6,.6]);
for i=1:1e8
sXYZ(:,3) = sXYZ(:,3) - [.1.*ones(90,1); .12.*ones(110,1)];
sXYZ(sXYZ(:,3)<-16, 3) = sXYZ(sXYZ(:,3) < -16, 3) + 17.5;
sHdl1.ZData = sXYZ(1:90,3); sHdl2.ZData = sXYZ(91:200,3);
view([i,30]); drawnow; pause(.05)
end
end
I wish all MATLABers a Merry Christmas in advance!
Speaking as someone with 31+ years of experience developing and using imshow, I want to advocate for retiring and replacing it.
The function imshow has behaviors and defaults that were appropriate for the MATLAB and computer monitors of the 1990s, but which are not the best choice for most image display situations in today's MATLAB. Also, the 31 years have not been kind to the imshow code base. It is a glitchy, hard-to-maintain monster.
My new File Exchange function, imview, illustrates the kind of changes that I think should be made. The function imview is a much better MATLAB graphics citizen and produces higher quality image display by default, and it dispenses with the whole fraught business of trying to resize the containing figure. Although this is an initial release that does not yet support all the useful options that imshow does, it does enough that I am prepared to stop using imshow in my own work.
The Image Processing Toolbox team has just introduced in R2024b a new image viewer called imageshow, but that image viewer is created in a special-purpose window. It does not satisfy the need for an image display function that works well with the axes and figure objects of the traditional MATLAB graphics system.
I have published a blog post today that describes all this in more detail. I'd be interested to hear what other people think.
Note: Yes, I know there is an Image Processing Toolbox function called imview. That one is a stub for an old toolbox capability that was removed something like 15+ years ago. The only thing the toolbox imview function does now is call error. I have just submitted a support request to MathWorks to remove this old stub.