搜索
Solve coding problems. Improve MATLAB skills. Have fun. See details and register .
I get students to create some figures in MATLAB Grader. Is there anyway the students can save the figure on their computer? I have tried savefig and that doesn't seem to do anything.
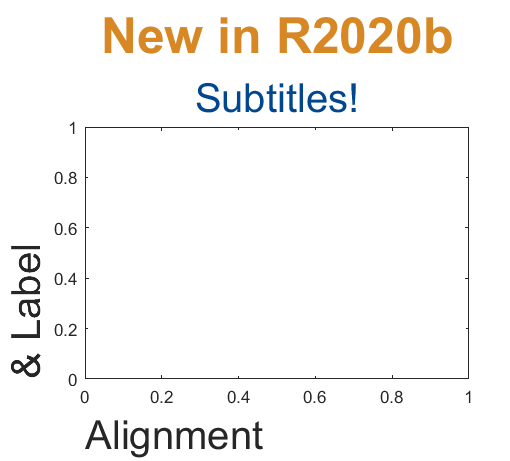
Add a subtitle
Multi-lined titles have been supported for a long time but starting in r2020b, you can add a subtitle with its own independent properties to a plot in two easy ways.
- Use the new subtitle function: s=subtitle('mySubtitle')
- Use the new second argument to the title function: [t,s]=title('myTitle','mySubtitle')
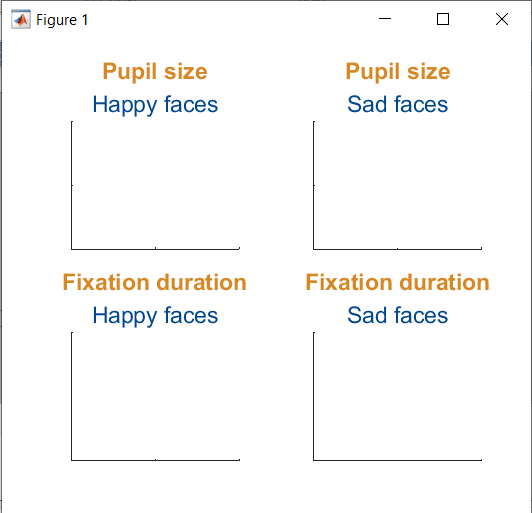
figure()
tiledlayout(2,2)
% Method 1
ax(1) = nexttile;
th(1) = title('Pupil size');
sh(1) = subtitle('Happy faces');
ax(2) = nexttile;
th(2) = title('Pupil size');
sh(2) = subtitle('Sad faces');
% Method 2
ax(3) = nexttile;
[th(3), sh(3)] = title('Fixation duration', 'Happy faces');
ax(4) = nexttile;
[th(4), sh(4)] = title('Fixation duration', 'Sad faces');
set(ax, 'xticklabel', [], 'yticklabel', [],'xlim',[0,1],'ylim',[0,1])
% Set all title colors to orange and subtitles colors to purple.
set(th, 'Color', [0.84314, 0.53333, 0.1451])
set(sh, 'Color', [0, 0.27843, 0.56078])
Control title/Label alignment
Title and axis label positions can be changed via their Position, VerticalAlignment and HorizontalAlignment properties but this is usually clumsy and leads to other problems when trying to align the title or labels with an axis edge. For example, when the position units are set to 'data' and the axis limits change, the corresponding axis label will change position relative to the axis edges. If units are normalized and the axis position or size changes, the corresponding label will no longer maintain its relative position to the axis, and that's assuming the normalized position was computed correctly in the first place.
Starting in r2020b, title and axis label alignment can be set to center|left|right, relative to the axis edges.
- TitleHorizontalAlignment is a property of the axis: h.TitleHorizontalAlignment='left';
- LabelHorizontalAlignment is a property of the ruler object that defines the x | y | z axis: h.XAxis.LabelHorizontalAlignment='left';

% Create data
x = randi(50,1,100)';
y = x.*[.2, -.2] + (rand(numel(x),2)-.5)*10;
gray = [.65 .65 .65];
% Plot comparison between columns of y
figure()
tiledlayout(2,2,'TileSpacing','none')
ax(1) = nexttile(1);
plot(x, y(:,1), 'o', 'color', gray)
lsline
ylabel('Y1 (units)')
title('Regression','Y1 & Y2 separately')
ax(2) = nexttile(3);
plot(x, y(:,2), 'd', 'color', gray)
lsline
xlabel('X Label (units)')
ylabel('Y2 (units)')
grid(ax, 'on')
linkaxes(ax, 'x')
%  Move title and labels leftward
set(ax, 'TitleHorizontalAlignment', 'left')
set([ax.XAxis], 'LabelHorizontalAlignment', 'left')
set([ax.YAxis], 'LabelHorizontalAlignment', 'left')
% Combine the two comparisons into plot and flip the second
% y-axis so trend are in the same direction
ax(3) = nexttile([2,1]);
yyaxis('left')
plot(x, y(:,1), 'o')
ylim([-6,16])
lsline
xlabel('X Label (units)')
ylabel('Y1 (units) \rightarrow')
yyaxis('right')
plot(x, y(:,2), 'd')
ylim([-16,6])
lsline
ylabel('\leftarrow Y2 (units)')
title('Direct comparison','(Y2 axis flipped)')
set(ax(3),  'YDir','Reverse')
% Align the ylabels with the minimum axis limit to emphasize the
% directions of each axis. Keep the title and xlabel centered
ax(3).YAxis(1).LabelHorizontalAlignment = 'left';
ax(3).YAxis(2).LabelHorizontalAlignment = 'right';
ax(3).TitleHorizontalAlignment = 'Center';       % not needed; default value.
ax(3).XAxis.LabelHorizontalAlignment = 'Center'; % not needed; default value.
Dear power electronics control community,
Since I have not solved the problem and have not found an answer to why I receive such an output, I would be happy when you could help me out. The actual project is much more extensive but easy schematic of what I want to do is here:
For that, I am using 2-level PWM generator: https://se.mathworks.com/help/physmod/sps/powersys/ref/pwmgenerator2level.html In the DC-link (DC voltage after the converter) the DC voltage output should be more-less constant (with a little noise) but right now it very far away from the desired output:

Does anyone have a idea what might cause this problem?
Take a look at this video on remote access robotics lab. It allows students to submit algorithms and have them run on a robot completely remotely.
Here (16:56) is where the submission process is explained.
Professor Christophe Demaziere from Chalmers University of Technology, Sweden created a short course on nuclear reactor modeling.
- The course followed a flipped and hybrid approach last year but will most likely be taught entirely online in future due to Covid-19 pandemic.
- MATLAB Grader greatly facilitates the Online nature of Christophe's courses.
- Student Feedback was also very positive saying that they learned better compared to the traditional approach.
I'm trying to list out some videos, courses, and other links to learn more about Machine and Deep Learning. Here are some links to getting started with AI/Machine Learning/Deep Learning with MATLAB:
Artificial Intelligence:
Machine Learning:
Data Analytics:
Neural Networks and Deep Learning:
If any of you are using other resources from the MathWorks website or elsewhere, please consider adding it below as a comment.
Thanks!
Hello,
I am a student. I am currently looking into graph neural networks (GNNs). My domain is electrical power systems. In electrical power systems, it is extremely important that we get an accurate desired output numerical value of electrical data from a neural network.
1) I have a basic question. Consider an electrical grid network of nodes. I am trying to learn this electrical grid network data using Graph Neural Network (GNN). Every node of a GNN accumulates data from neighboring nodes, then processes it by a few steps of an algorithm, and passes it to the next layer. Finally, data is passed through a non-linearity and then to the output layer of the GNN.
But, if I feed electrical data to the above process, the original value of data at every node gets manipulated by several processing operations, and especially after passing the manipulated data through a non-linearity at the final stage, the output is obtained only in the form of 1's and 0s. Hence, the original electrical data value at every node is totally lost. On the contrary, I am expecting an output of an "accurate" value of electrical data similar to original value electrical data at every node of the network.
How to address the above problem? Please explain systematically if possible. This is a genuine basic question.
2) Also, does anyone have a clue, why Graph Neural Networks (GNNs) have not been introduced yet as a toolbox or in general in Matlab?
Help and opinion on above questions would be greatly appreciated.
Hi Everyone, I am trying to simulate the third-order model of the synchronous generator (figure below). but I have no idea how to do this. Any help would be great.
help
Thank you for your helping. I'm trying to import csv files form a folder, however it does not work.
The following code might be wrong.. fname=mtlb_dir('Users/shogo/Left_Leg_Single-Leg_Landing/SLLExport/*.exp')
I appreciate it if you help,
Sincerely, Shogo
This year, the 3-day MATLAB workshop is going Virtual: October 11-13 2020. (Sunday evening - Tuesday afternoon, CST). If you're teaching science, math, engineering or related disciplines, consider signing up now. The application deadline is July 31st. Apply for the workshop: Workshop Application
Details: Name: Teaching Online Computation Using MATLAB (Virtual) Date: October 11-13 2020 (Sunday afternoon -- Tuesday mid-afternoon, US time zones) Location: Zoom session Audience: Educators teaching undergraduate and graduate-level science, math, engineering and related disciplines
At the 2020 virtual workshop, you’ll have opportunities to • Curriculum: Upgrade your curriculum with a focus on transitioning to online learning • Mentoring: Meet in 1-on-1 coaching sessions with faculty, education professionals, and MATLAB experts • Publish and Cite: Get your teaching activities peer reviewed and citable for inclusion in your CV • Community: Collaborate with and build connections to a network of educator peers all working on impactful computational skill development in their courses • Learn: Learn how to embed new MATLAB tools in courses to improve student learning (Note that the workshop will use online technologies to enable 1-on-1 mentoring, group work, and community building. As in past years, the focus will be curriculum development, less presentation.)
In addition, you’ll have the chance to learn how to incorporate MATLAB Live Scripts, MATLAB Online, MATLAB Grader, and more.
This virtual will include working groups for building your curriculum. Participants will be matched with like educators.
Apply now to save your spot and help the conveners plan effective groups.
The workshop hosts will review applications and send acceptances status by early August.
Looking forward to your participation in the workshop, Cathy Manduca, Executive Director, SERC Lisa Kempler, Sponsor, MathWorks Don Baker, McGill University, workshop convener Dan Burleson, University of Houston, workshop convener and review editor Kelly Roos, Bradley University, workshop convener and reviewer Kristi Closser, California State University, Fresno, workshop convener and reviewer
P.S. For reference, 2019 workshop program
Looking to get Solar Grid Tie Inverter developed including Hardware + Software + Enclosure design (IP 65) for single phase inverters from 1 KW to 6 KW.
Here's an thread on comparing various types of instructional labs (on-campus, virtual, remote, kits). Each type has pros/cons and things that you need to consider.
Starting in r2020a , you can change the mouse pointer symbol in apps and uifigures.
The Pointer property of a figure defines the cursor’s default pointer symbol within the figure. You can also create your own pointer symbols (see part 3, below).
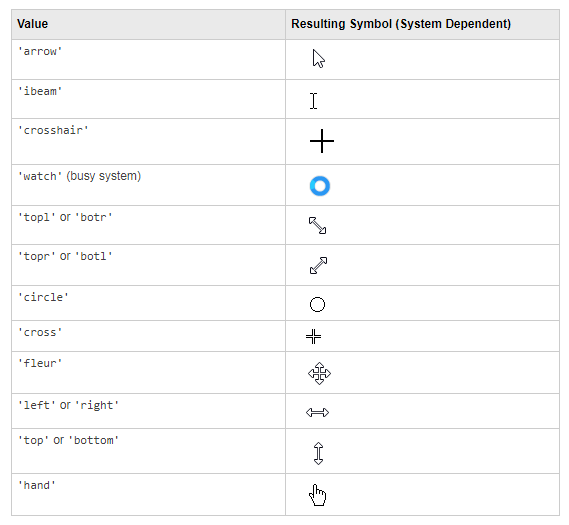
Part 1. How to define a default pointer symbol for a uifigure or app
For figures or uifigures, set the pointer property when you define the figure or change the pointer property using the figure handle.
% Set pointer when creating the figure
uifig = uifigure('Pointer', 'crosshair');
% Change pointer after creating the figure
uifig.Pointer = 'crosshair';
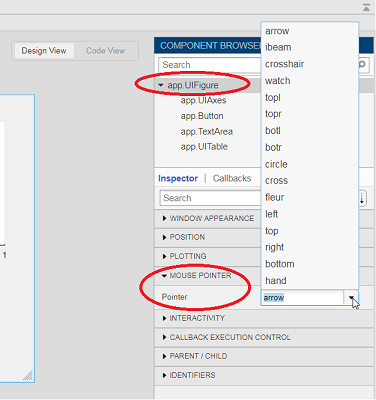
For apps made in AppDesigner, you can either set the pointer from the Design View or you can set the pointer property of the app’s UIFigure from the startup function using the second syntax shown above.
Part 2. How to change the pointer symbol dynamically
The pointer can be changed by setting specific conditions that trigger a change in the pointer symbol.
For example, the pointer can be temporarily changed to a busy-symbol when a button is pressed. This ButtonPushed callback function changes the pointer for 1 second.
function WaitasecondButtonPushed(app, event)
   % Change pointer for 1 second.
   set(app.UIFigure, 'Pointer','watch')
   pause(1)
   % Change back to default.
   set(app.UIFigure, 'Pointer','arrow')
   app.WaitasecondButton.Value = false;
end
The pointer can be changed every time it enters or leaves a uiaxes or any plotted object within the uiaxes. This is controlled by a set of pointer management functions that can be set in the app’s startup function.
iptSetPointerBehavior(obj,pointerBehavior) allows you to define what happens when the pointer enters, leaves, or moves within an object. Currently, only axes and axes objects seem to be supported for UIFigures.
iptPointerManager(hFigure,'enable') enables the figure’s pointer manager and updates it to recognize the newly added pointer behaviors.
The snippet below can be placed in the app’s startup function to change the pointer to crosshairs when the pointer enters the outerposition of a uiaxes and then change it back to the default arrow when it leaves the uiaxes.
% Define pointer behavior when pointer enter axes
pm.enterFcn = @(~,~) set(app.UIFigure, 'Pointer', 'crosshair');
pm.exitFcn  = @(~,~) set(app.UIFigure, 'Pointer', 'arrow');
pm.traverseFcn = [];
iptSetPointerBehavior(app.UIAxes, pm)
% Enable pointer manager for app
iptPointerManager(app.UIFigure,'enable');
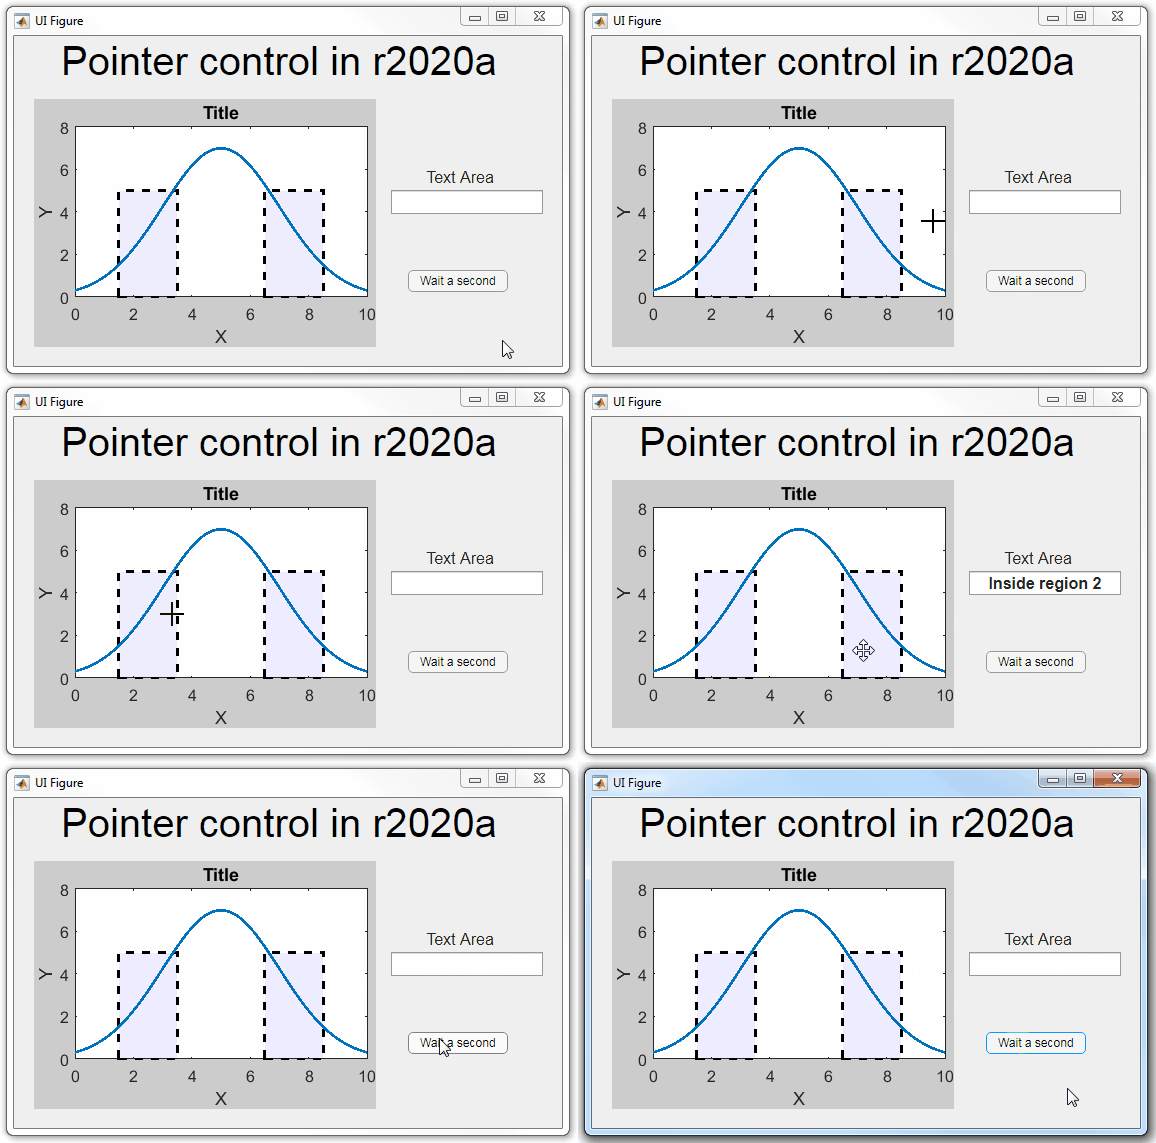
Any function can be triggered when entering/exiting an axes object which makes the pointer management tools quite powerful. This snippet below defines a custom function cursorPositionFeedback() that responds to the pointer entering/exiting a patch object plotted within the uiaxes. When the pointer enters the patch, the patch color is changed to red, the pointer is changed to double arrows, and text appears in the app’s text area. When the pointer exits, the patch color changes back to blue, the pointer changes back to crosshairs, and the text area is cleared.
% Plot patch on uiaxes
hold(app.UIAxes, 'on')
region1 = patch(app.UIAxes,[1.5 3.5 3.5 1.5],[0 0 5 5],'b','FaceAlpha',0.07,...
    'LineWidth',2,'LineStyle','--','tag','region1');
% Define pointer behavior for patch
pm.enterFcn = @(~,~) cursorPositionFeedback(app, region1, 'in');
pm.exitFcn  = @(~,~) cursorPositionFeedback(app, region1, 'out');
pm.traverseFcn = [];
iptSetPointerBehavior(region1, pm)
% Enable pointer manager for app
iptPointerManager(app.UIFigure,'enable');
function cursorPositionFeedback(app, hobj, inout)
% When inout is 'in', change hobj facecolor to red and update textbox.
% When inout is 'out' change hobj facecolor to blue, and clear textbox.
% Check tag property of hobj to identify the object.
switch lower(inout)
    case 'in'
        facecolor = 'r';
        txt = 'Inside region 1';
        pointer = 'fleur';
    case 'out'
        facecolor = 'b';
        txt = '';
        pointer = 'crosshair';
end
hobj.FaceColor = facecolor;
app.TextArea.Value = txt;
set(app.UIFigure, 'Pointer', pointer)
end
The app showing the demo below is attached.
Part 3. Create your own custom pointer symbol
- Set the figure’s pointer property to ‘custom’.
- Set the figure’s PointerShapeCData property to the custom pointer matrix. A custom pointer is defined by a 16x16 or 32x32 matrix where NaN values are transparent, 1=black, and 2=white.
- Set the figure’s PointerShapeHotSpot to [m,n] where m and n are the coordinates that define the tip or "hotspot" of the matrix.
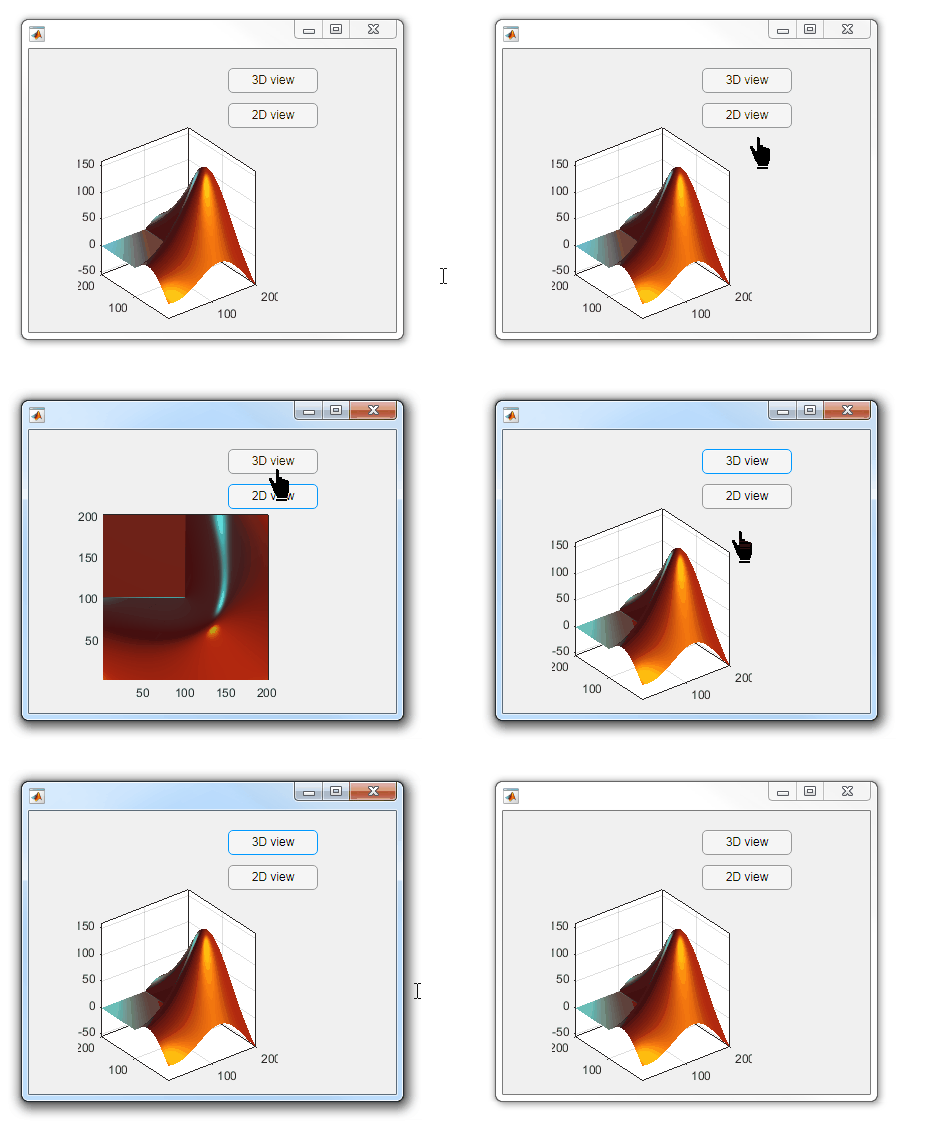
This demo uses the attached mat file to create a black hand pointer symbol.
iconData = load('blackHandPointer.mat');
uifig = uifigure();
uifig.Pointer = 'custom';
uifig.PointerShapeCData = iconData.blackHandIcon;
uifig.PointerShapeHotSpot = iconData.hotspot;
Also see Jiro's pointereditor() function on the file exchange which allows you to draw your own pointer.
As an environment for modeling, simulating, and testing dynamic systems, Simulink is used for:
- Creating virtual simulation labs for interactively exploring technical concepts and building intuition in areas like controls , circuits , mechanics , and signal processing
- Collaborating and implementing software- and hardware-based projects in areas like robotics, instrumentation, and FPGA’s
Simulink is now available in a web browser as Simulink Online.
Simulink Online is available to anyone with access to MATLAB Online (see supported license types here) and a Simulink license.
Just sign into MATLAB Online and either start Simulink or open a Simulink model.
Learn more about Simulink Online at the product page on our website.
Simulink Online currently supports the following toolboxes, with more to be added in the future!
- Simulink
- Stateflow
- Simscape
- Simscape Electrical
- Simscape Multibody
- Simulink Control Design
- DSP System Toolbox
MathWorks gave a perspective on 'Bridging the Technology Readiness Gap with Simulation and Virtual/Remote Testbenches' at the Opal-RT RT20 Panel Session on The Role of Real-Time Simulation in Education. Listen to a recording of the panel session, and also hear perspectives from Quanser, Hydro-Quebec, and RWTH Aachen, by registering for the RT20 conference at the following link .
The EMEA (Europe, Middle East and Africa) Academic Engineering Team are hosting a series of live online webinars every Tuesday and Wednesday. Get up to speed with online teaching and research with MATLAB and access ready-to-use resources.
Watch the introductory video and register here
