主要内容
搜索
Recently, I came across a post about the JIT compiler on this Korean blog. In the post. The writer discussed the concept of the "Compile Threshold" and how it is calculated.
"The JVM accumulates the number of calls for each method called and compiles when the number exceeds a certain number. In other words, there is a standard for checking how often it is called and then deciding, 'It is time to compile.' This standard is called the compilation threshold. But what is this and why should it be used as a standard?"
The concept of the "Compile Threshold," as used above, seems to be more commonly associated with Tracing just-in-time compilation.
The writer used the simple Java code below to calculate the threshold.
for (int i = 0; i < 500; ++i) {
long startTime = System.nanoTime();
for (int j = 0; j < 1000; ++j) {
new Object();
}
long endTime = System.nanoTime();
System.out.printf("%d\t%d\n", i, endTime - startTime);
}
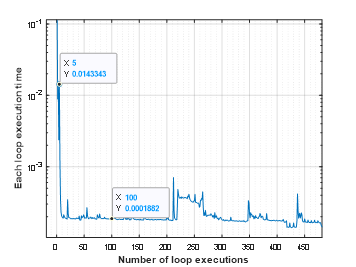
Since the MATLAB execution engine uses JIT compilation, I just wanted to perform the same experiment that the writer did.
I experimented using simple codes based on the code in the blog. I iterated a function 500 time using for-loop and calculated the execution time for each iteration using tic and toc. Then I plotted the execution time for each loop as blow. First five execution times are much higher than followings (10 times!) The test is very rough so I am not sure that I can conclude "MATLAB has Compile Threshold and it is 5!" but this value is actually correct ;-)
t0 = 0;
tfinal = 10;
y0 = [20;20];
timeToRun = zeros(500,1);
for i = 1:500
tStart = tic;
[preypeaks,predatorpeaks] = solvelotka(t0, tfinal, y0);
tEnd = toc(tStart);
timeToRun(i) = tEnd;
end
VS Code Extension for MATLAB was introduced back in April and has been downloaded 75K times since. Do people here use VS Code for writing MATLAB code?
Would it be a good thing to have implicit expansion enabled for cat(), horzcat(), vertcat()? There are often situations where I would like to be able to do things like this:
x=[10;20;30;40];
y=[11;12;13;14];
z=cat(3, 0,1,2);
C=[x,y,z]
with the result,
C(:,:,1) =
10 11 0
20 12 0
30 13 0
40 14 0
C(:,:,2) =
10 11 1
20 12 1
30 13 1
40 14 1
C(:,:,3) =
10 11 2
20 12 2
30 13 2
40 14 2
Earlier this year a bunch of MATLAB users got together to talk about their hobbies in a lightning talk format.
- Using "UIHTML" to create app components and Lightning
- Creating generative art with MATLAB
- Making MATLAB run on the Steam Deck (it was a wager)
Do you use MATLAB for hobbies?
Are there Matlab features which intend to satisfy your needs but fail in certain critical areas, forcing you to abandon them completely in favor of your own version or a 3rd party alternative? Perhaps these features are starting to improve with new Matlab releases, but not quickly enough? Share your own frustrations in the comments below.
Here are two of mine:
1. volumeViewier
volumeViewer is 6 years old now. It is fine when you only need to view one 3D image at a time, but I never do. In my work, I am putting several images side-by-side for visual comparison. For such work, you need to be able to programmatically change axis limits and grayscale and use linkprop to reflect these changes across all the images. With 2D image comparison, all that is possible, but volumeViewer supports none of those things. So, I resort to my own 3D viewer
2.Tomographic projection commands RADON and FANBEAM
These commands are provided in the Image Processing Toolbox seemingly for no other reason than to support homework exercises for people taking introductory tomographic imaging courses. They fail in a number of ways for people who need to do serious tomographic imaging work, producing artifacts or nonlinear effects which shouldn't be there. See for example Why isn't FANBEAM linear? or Radon Transform works unexpectedly. Moreover, the toolbox still provides tomographic projectors only for 2D imaging not 3D, even though 64-bit RAM has made volumetric imaging commonplace in Matlab for at least 10 years. Luckily, there are now freely available 3rd party alternatives like TIGRE.
Have you ever learned that something you were doing manually in MATLAB was already possible using a built-in feature? Have you ever written a function only to later realize (or be told) that a built-in function already did what you needed?
Two such moments come to mind for me.
1. Did you realize that you can set conditional breakpoints? Neither did I, until someone showed me that feature. To do that, open or create a file in the editor, right click on a line number for any line that contains code, and select Set Conditional Breakpoint... This will bring up a dialog wherein you can type any logical condition for which execution should be paused. Before I learned about this, I would manually insert if-statements during debugging. Then, after fixing each bug, I would have to delete those statements. This built-in feature is so much better.
2. Have you ever needed to plot horizontal or vertical lines in a plot? For the longest time, I would manually code such lines. Then, I learned about xline() and yline(). Not only is less code required, these lines automatically span the entire axes while zooming, panning, or adjusting axis limits!
Share your own Aha! moments below. This will help everyone learn about MATLAB functionality that may not be obvious or front and center.
(Note: While File Exchange contains many great contributions, the intent of this thread is to focus on built-in MATLAB functionality.)
The carot symbol on my keyboard (ˆ shift+6) doesn't work on matlab. Matlab doesn't recognize it so I can't write any equation with power symbol. I tried every possible solution on the web and it doesn't work. even in the character viewer I don't have any result when I search ''caret".
Exciting news for students! 🚀Simulink Student Challenge 2023 is live! Unleash your engineering skills and compete for exciting rewards. Submission deadline is December 12th, 2023!

In the past year, we've witnessed an exponential growth of ChatGPT and other Generative AI tools. AI has quickly become a transformative force across industries, from tech giants to small startups, and even community sites like ours. For instance, Stack Overflow announced its plan to leverage AI tools to draft a question or tag content; Quora built a ChatGPT bot to answer questions; and GitHub is piloting the AI tool for personalized content.

This trend in the community landscape makes me wonder what MATLAB Central community, especially in MATLAB Answers, can do to integrate AI and enhance the community.
Share with us your ideas in the comment session. Ideally one comment per idea, so that others can vote on a secific idea or have deeper discussions about it.
Adam and Heather will be discussing new features in R2023b and answering your questions in a few hours - visit the link below to check out the preview and sign up for notification.
We launched the Discussions area with 6 channels, based on the existing types of content we see today in the MATLAB Central community.
I'm curious which channels you are most interested in participating, or which channels are missing.
Tell us your thoughts here!
Adam Danz just launched a new blog about MATLAB Graphics and App Building.
As you know, He has been a prolific contributor to MATLAB Answers and one of his answers recently won the Editor's Choice Award.
If there are any topics or questions you are interested in, please share with Adam, and I am sure he will get those into his blog.
Over the weekend I came across a pi approximation using durations of years and weeks (image below, Wolfram, eq. 89), accurate to 6 digits using the average Gregorian year (365.2425 days).
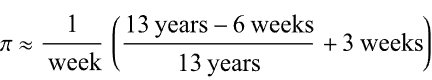
Here it is in MATLAB. I divided by 1 week at the end rather than multiplying by its reciprocal because you can’t divide a numeric by a duration in MATLAB (1/week).
weeks = @(n)n*days(7);
piApprox = ((years(13)-weeks(6))/years(13) + weeks(3)) / weeks(1)
% piApprox = 3.141593493469302
Here’s a breakdown
- The first argument becomes 12.885 yrs / 13 yrs or 0.99115
- Add three weeks: 0.99115 + 3 weeks = 21.991 days
- The reduced fraction becomes 21.991 days / 7 days
Now it looks a lot closer to the more familiar approximation for pi 22/7 but with greater precision!
Need help about FPGA Based VSC HVDC Real Time Simulation Model.
This person used computer version to build a keyboard input, and used standard flag semaphore for the positions.
Flag semaphore is used mostly by sailors to be able to communicate optically over a distance; it does not need anything more than make-shift flags (but binoculars or telescopes can help.) Trained users can go faster than you might guess.
Chen, Rena, and I are at a community management event. It's great to be with others talking about relationships, trust, and co-creation.
A research team found a way to trick a number of AI systems by injecting carefully placed nonsense -- for example being able able to beat DeepMind's Go game.
This video discusses the "Cody" bridge, which is a pedestrian bridge over a canal that has been designed to move up and out of the way when ships need to travel through. The mathematics of the bridge movement are discussed and diagrammed. It is unique and educational.
Recently developed: a "microscope" based on touch and stereo vision.
Using touch removes the possibility of optical confusion -- for example, black on touch is only due to shape, not due to the possibility that the object has a black patch.
Sorry, you might need a Facebook account to watch the video.
I'm curious how the community uses the hold command when creating charts and graphics in MATLAB. In short, hold on sets up the axes to add new objects to the axes while hold off sets up the axes to reset when new objects are added.
When you use hold on do you always follow up with hold off? What's your reasoning on this decision?
Can't wait to discuss this here! I'd love to hear from newbies and experts alike!
您也可以从以下列表中选择网站:
美洲
- América Latina (Español)
- Canada (English)
- United States (English)
欧洲
- Belgium (English)
- Denmark (English)
- Deutschland (Deutsch)
- España (Español)
- Finland (English)
- France (Français)
- Ireland (English)
- Italia (Italiano)
- Luxembourg (English)
- Netherlands (English)
- Norway (English)
- Österreich (Deutsch)
- Portugal (English)
- Sweden (English)
- Switzerland
- United Kingdom(English)
亚太
- Australia (English)
- India (English)
- New Zealand (English)
- 中国
- 日本Japanese (日本語)
- 한국Korean (한국어)