主要内容
Results for
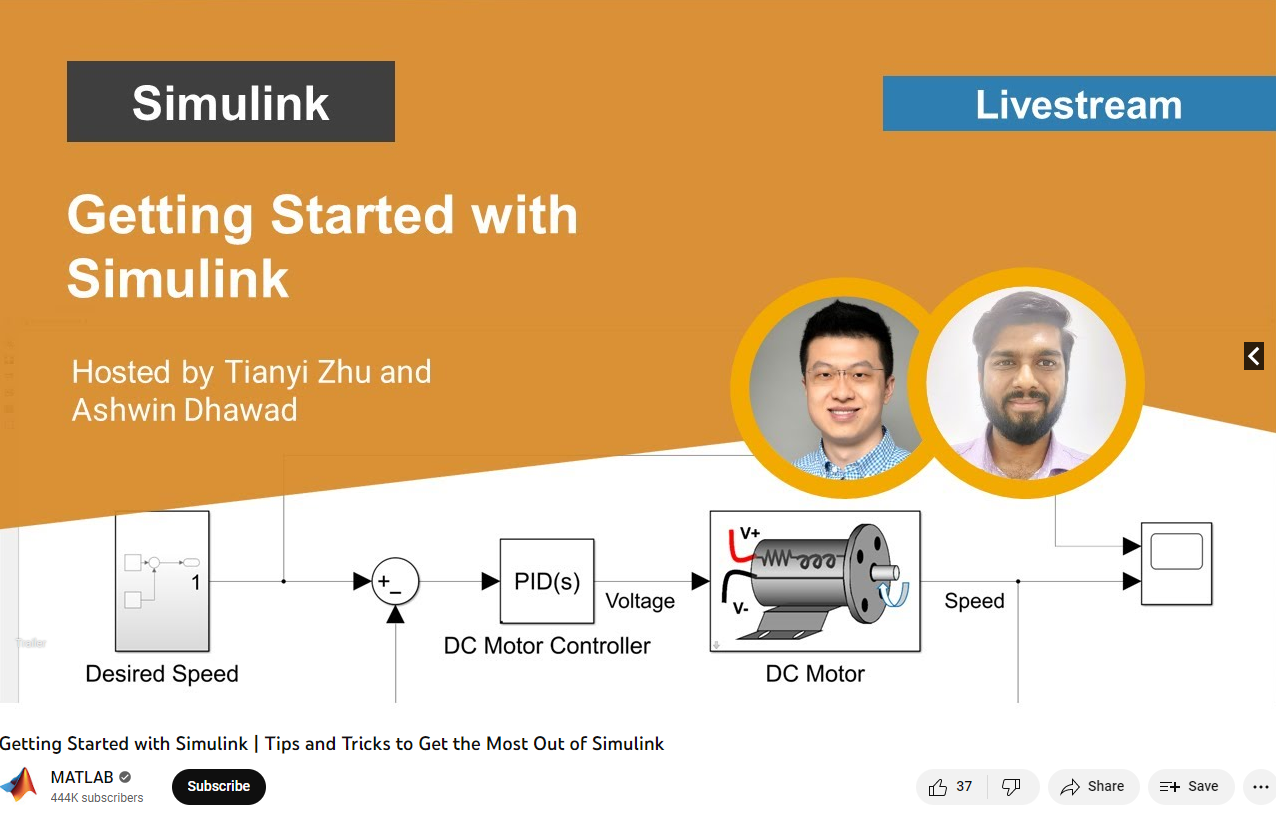
Getting Started with Simulink | Tips and Tricks to Get the Most Out of Simulink
Watch live as Tianyi Zhu and Ashwin Dhawad walk through how you can get started with Simulink by modeling, simulating, and tuning a PID controller for a DC Motor. This session isn’t just for beginners; they will show you the latest and greatest tips and tricks to help you get the most out of Simulink.
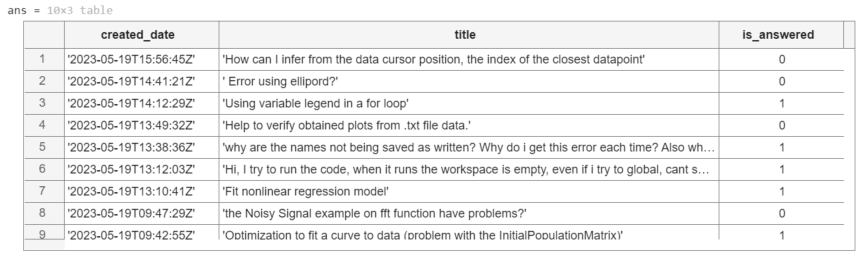
MATLAB Central has been great community-based MATLAB resources, but you can now access its content programmatically via the public API, and I created a MATLAB function to take advantage of that. You can learn more here https://api.mathworks.com/community
Example:
data = searchMATLABCentral("plotting",scope="matlab-answers",sort_order="created desc",created_after=datetime("2023-01-01"));
T = struct2table(data.items);
T(:,["created_date","title","is_answered"])
Output
Function
function results = searchMATLABCentral(query,options)
% SEARCGMATLABCENTRAL retrieves content of the MATLAB Central for a given
% query and returns the result as a struct.
% The function uses MathWorks RESTful API to search for content.
% The API is rate limited via IP throttling. No authentication is required.
% See API documentation for more details https://api.mathworks.com/community
%
% Input Arguments:
%
% query (string) - Required. The search query string.
% scope (string) - Optional. Specify the artifact. If not specified,
% the scope defaults to 'matlab-answers'.
% Other options include 'file-exchange','blogs','cody',
% 'community-highlights', and 'community-contests'.
% tags (string) - Optional. Specify a comma-separated list of tags.
% created_before (datetime) - Optional. Specify the last date in the results
% created_after (datetime) - Optional. Specify the first date in the results
% sort_order (string) - Optional. Speficy the order of the results.
% If not specified, it defaults to "relevance desc".
% Other options include 'created asc', 'created desc',
% 'updated asc','updated desc', 'relevance asc',
% and 'relevance desc'.
% page (integer) - Optional. Specify the page to retrieve.
% If the 'has_more' field in the result is positive,
% increment this argument to retrieve the next page.
% count (integer) - Optional. Specify the number of results as a value
% between 1 and 50; The default is 10.
%
% Output Arguments:
%
% results (struct) - Structure array containing the results of the search.
% validate input arguments
arguments
query string {mustBeNonzeroLengthText,mustBeTextScalar}
options.scope string {mustBeMember(options.scope,["matlab-answers", ...
"file-exchange","blogs","cody","community-highlights", ...
"community-contests"])} = "matlab-answers";
options.tags string {mustBeNonzeroLengthText,mustBeVector}
options.created_before (1,1) datetime
options.created_after (1,1) datetime
options.sort_order string {mustBeMember(options.sort_order,["created asc", ...
"created desc","updated asc","updated desc","relevance asc","relevance desc"])}
options.page double {mustBeInteger,mustBeGreaterThan(options.page,0)}
options.count double {mustBeInteger,mustBeInRange(options.count,1,50)}
end
% API URL and endpoint
url = "https://api.mathworks.com/community";
endpoint = "/v1/search";
% convert MATLAB datetime to the internet datetime format string
if isfield(options,"created_before")
options.created_before = string(options.created_before,"yyyy-MM-dd'T'HH:mm:ss'Z'");
end
if isfield(options,"created_after")
options.created_after = string(options.created_after,"yyyy-MM-dd'T'HH:mm:ss'Z'");
end
% convert optional inputs into a cell array of key-value pairs
keys = fieldnames(options);
vals = struct2cell(options);
params = [keys,vals].';
% call the API
try
results = webread(url+endpoint,"query",query,params{:});
catch ME
rethrow(ME)
end
end
Congratulations, @John D'Errico for winning the Editor's Pick badge awarded for MATLAB Answers, in recognition of your awesome solution in What to be chosen c so that all elements of matrix B will be a round number. B=A.c; where A is the matrix of non integers. The OP has not accepted his answer yet, but
As with other nominated answers, you provided detailed explanation with examples to show that what the OP is looking for may not be possible in some cases.
Unfortunately, you can only get this badge once - perhaps this raises a question about how this award should work. In any case, we nonetheles appreciate your ongoing effort to help other users in the community. Thnk you so much!
MATLAB Central Team
Object Detection and Tracking using Computer Vision
In this event, Matt and Megan show you how to perform one or the more difficult task in computer vision: tracking multiple objects.
They will walk through an example from the new Coursera specialization, Computer Vision for Engineering and Science. The code and video used in the example are available to those who sign up for the specialization.

AI
22%
Wireless Connectivity and Radar
4%
Autonomous Systems and Robotics
15%
Cloud, Enterprise, and DevOps
2%
Algorithms and Data Analytics
17%
Modeling and Simulation
36%
179 个投票
<= 6 GB
10%
7–12 GB
26%
13–22 GB
34%
23–46 GB
19%
47–90 GB
6%
>= 91 GB
6%
15925 个投票
Yes, the available tools are great
12%
Yes, the available tools need help
6%
No, but I would like to
14%
No, it is not important to me
7%
What is test-driven development?
61%
1955 个投票
Always
12%
Sometimes
11%
In the past, but not now
3%
Never
20%
What is Simulink Project?
53%
2443 个投票
Always
8%
Sometimes
9%
In the past, but not now
2%
Never
23%
What is MATLAB Project?
58%
4533 个投票
Absolute path
14%
Relative inside the top project
48%
Relative outside the top project
19%
All the above
19%
21 个投票
Beginner, Novice, still learning
50%
Adequate, I can get by easily
34%
Proficient / fluent can do anything
12%
Grand Master, one of the very best
3%
2510 个投票
AI, Robotics, Autonomous Systems: MATLAB EXPO is coming up soon and it is time to register. It's free and open to everyone. You will have the opportunity to connect with engineers, scientists, educators, and researchers, and new ideas.
disp('It is time to register for MATLAB EXPO 2023!');
Featured Sessions:
- Project-Based Learning and Design with Simulation - Professor Claire Lucas, King’s College London
- How Siemens Energy Enables the Global Energy Transition - Jens Dietrich, Siemens Energy AG
Features Topics:
- AI
- Autonomous Systems
- Electrification
- Robotics

Congratulations, @John D'Errico for winning the Editor's Pick badge awarded for MATLAB Answers, in recognition of your awesome solution in How to fit a biexponential decay function
You explained the general process of solving this problem and explored several options until he got to the a good model. This is very instructional and would be useful for anyone who run into similar problems.
Unfortunately, you can only get this badge once - so there will be no new badge for you this time, but we nonetheles appreciate your ongoing effort to help other users in the community. Thnk you so much!
MATLAB Central Team
If you use MATLAB online, you might already know about the advanced search feature that groups your results into the top suggestions by type of result – such as examples functions or blocks. This release, there is a new group for video results: you can see an icon sized thumbnail and the video length all in the search box dialog.
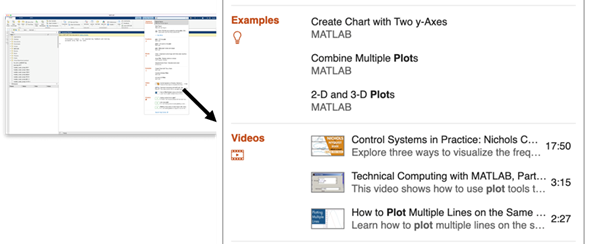
Try out all the search groups - you can even try it out in dark mode!
Heather and Yann talk about their journeys that span both open-source and MATLAB and Jousef ask them what they think of MATLAB vs. Python, and AI in general, including ChatGPT. It is a very casual and open conversation about range of interesting topics. Don't miss it!
Congratulations, @the cyclist for winning the Editor's Pick badge awarded for MATLAB Answers, in recognition of your awesome solution in Center of gaussian mixed distribution area.
Thank you for going to great lengths to help a user in this thread. It appears you downloaded the academic paper and read parts of it to figure out how to help the user.
This is a new badge we just introduced to recognize awesome answers people contribute and yours was picked for discovering a creative way to solve the problem, and made the solution clear, and reproducible. Thank you so much for setting a high standard for MATLAB Answers and for your ongoing contribution to the community.
MATLAB Central Team
You provided 37,574 anwers and received 11,750 votes. You are ranked #2 in the community, Thank you for your contribution to the community!
MATLAB Central Team
Word (Crossword , Wordle, etc.)
19%
Numerical (Sudoku, math, etc.)
33%
Brain teaser, logic
27%
Jigsaw, picture, finding/matching
9%
Wooden, metal, or other mechanical
10%
Other type (comment below)
2%
4398 个投票
With the release of MATLAB R2023a, we also are giving you early access to the new MATLAB Desktop. This includes Dark Mode! Download via Add-on Explorer in MATLAB or find here on File Exchange.
These are some of the many enhancements and new features of the new desktop:
- Dark mode / theme support - Change the colors of the desktop by selecting a dark theme.
- Updated layout - Quickly access tools and change your layout using the sidebar.
- Expanded search capabilities - Easily find actions, settings, and resources using the new universal search box.
- Figure toolstrip - Use the new figure toolstrip to easily modify annotations, text, and line styles, and view generated code.
- Keyboard and screen reader accessibility support - Use a screen reader to interact with the Command Window, Editor and desktop tools.
- Enhanced MATLAB Projects workflows - Collaborate using an improved user interface, manage multiple repositories using the Branch Manager, and investigate project hierarchies using the new Dependency Analyzer view.
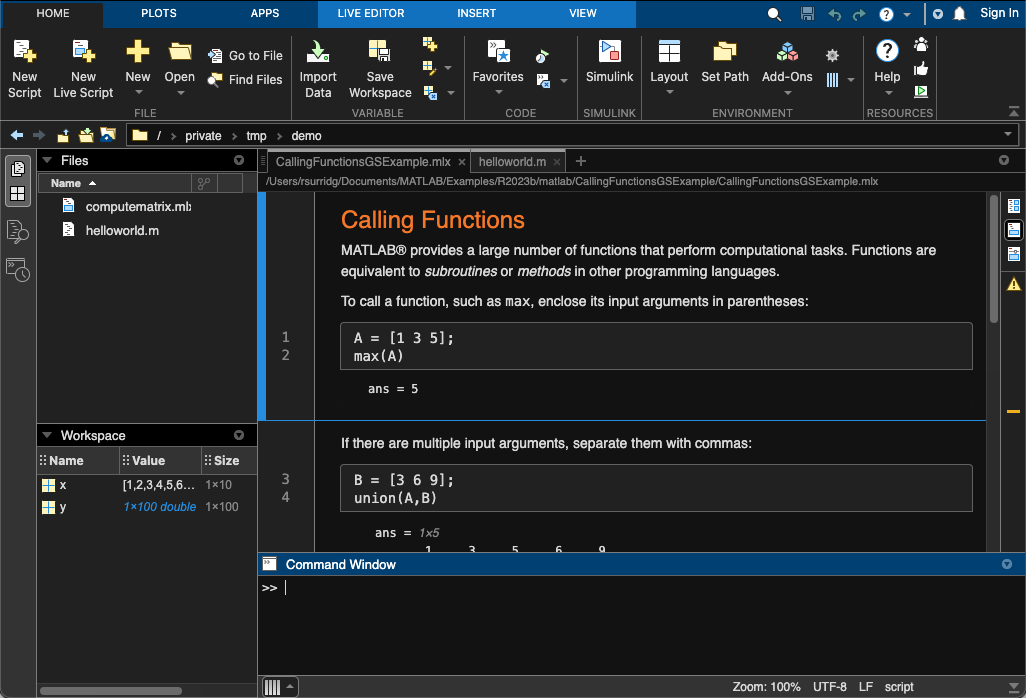
Have fun trying it out and let us know what you think!
您也可以从以下列表中选择网站:
美洲
- América Latina (Español)
- Canada (English)
- United States (English)
欧洲
- Belgium (English)
- Denmark (English)
- Deutschland (Deutsch)
- España (Español)
- Finland (English)
- France (Français)
- Ireland (English)
- Italia (Italiano)
- Luxembourg (English)
- Netherlands (English)
- Norway (English)
- Österreich (Deutsch)
- Portugal (English)
- Sweden (English)
- Switzerland
- United Kingdom(English)
亚太
- Australia (English)
- India (English)
- New Zealand (English)
- 中国
- 日本Japanese (日本語)
- 한국Korean (한국어)