ThingSpeak Community
Writing X & Y values for a bar graph, not time dependant
Stuart
2023-3-30
最新活动 由 Christopher Stapels
回复于 2023-3-30
Hello,
I am setting up a home energy monitoring system, all started from a blank sheet in arduino and its really working very well.
I would like to send data to thinkspeak which is not time dependant, i.e. send the X and Y values and format as a bar graph. The reason is, i have 12 channels monitoring energy (Wh) and i have this in an array which i plot on a local LCD and throughout the day the bars grow in height as the usage attributed to that channel grows. How can i do something similar in thing speak which by default applies a time stamp to received data.
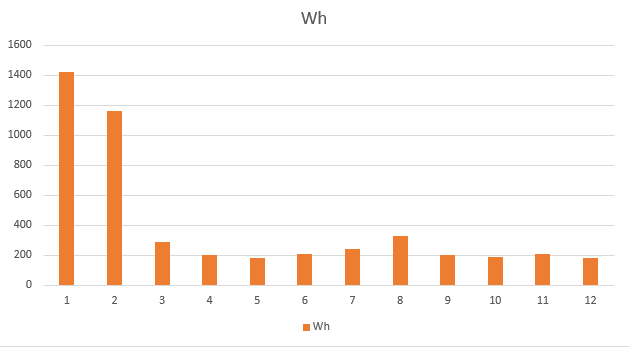
Very simply, each channel has an ID (0-11) and a number associated with the accumulative Wh. I have a similar thing in excel for development where my serial port data is saved to a csv which excell imports every minute and updates a bar graph a bit like this;
Ive had a good look (perhaps not good enough!) and i just cant see how this may be acheived with thingspeak without a clumbersome combination of 2 channels (given each channel has 8 fields) and then using a matlab visualisation to pull it all together. Perhaps its not has hard / messy as it sounds? I am paid user so can create extra channels if required.
Thanks,
Stuart
3 个评论
Nice project! I think a MATLAB vis plus channels would not be too hard / messy (I have 100 of both).
But there may be a simpler way. Is all the data in ThingSpeak now? Does the data you use to make the plot come from ThingSpeak? If so, then we can definitely do it with just a MATLAB vis (no extra channels required)
As a paid user, you can set the MATLAB visualization plot to autoupdate as well.(though I think it is every 5 minutes that it will autorefresh)
Alternatively, you could use one channel, and write the 12 values you want to the channel, and then set the plot to only show the last 12 entries. Set the type as bar or column. Then you get something like this, though the axis still shows time. If you wrote timestamps (created_at) with your values where the timestamps has the present time to the minute, but then were 1 second apart starting with 1 second then 2 seconds, etc, then the scale at the bottom would roughly have the label that you want.
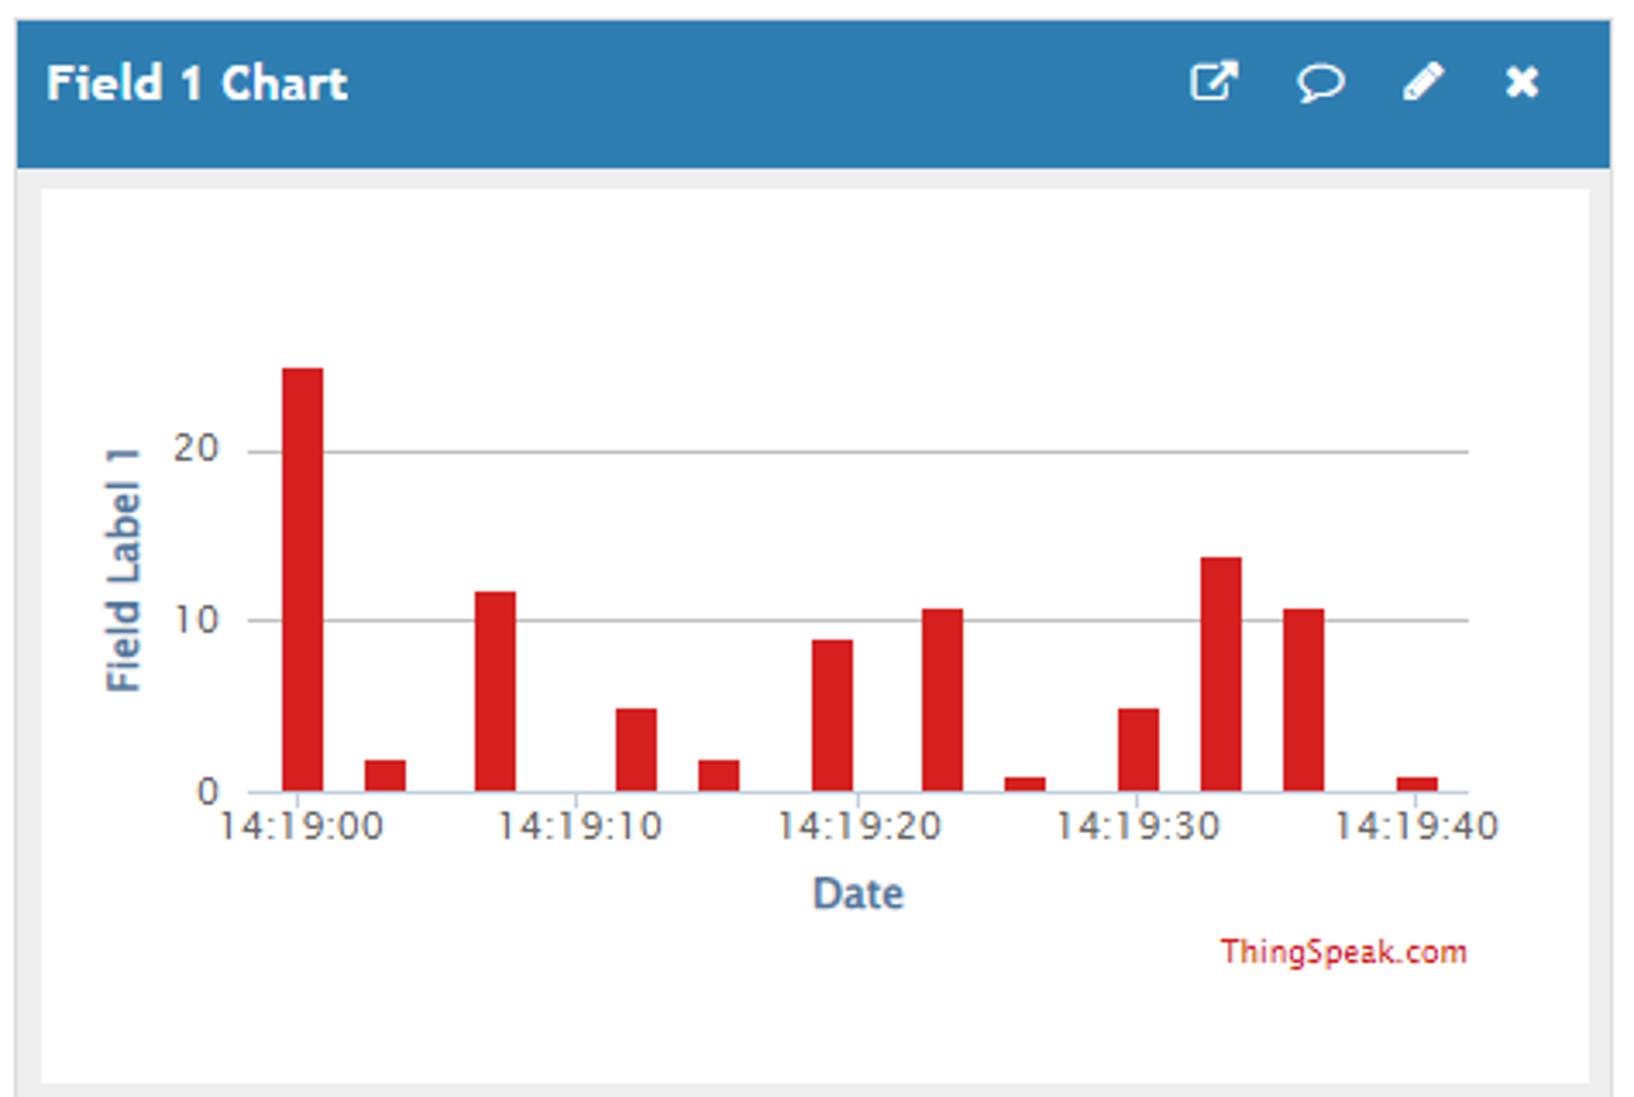
So I tried that, and you have to expand the plot to get the axis to do what you want, but it was fun to try. Here it is:
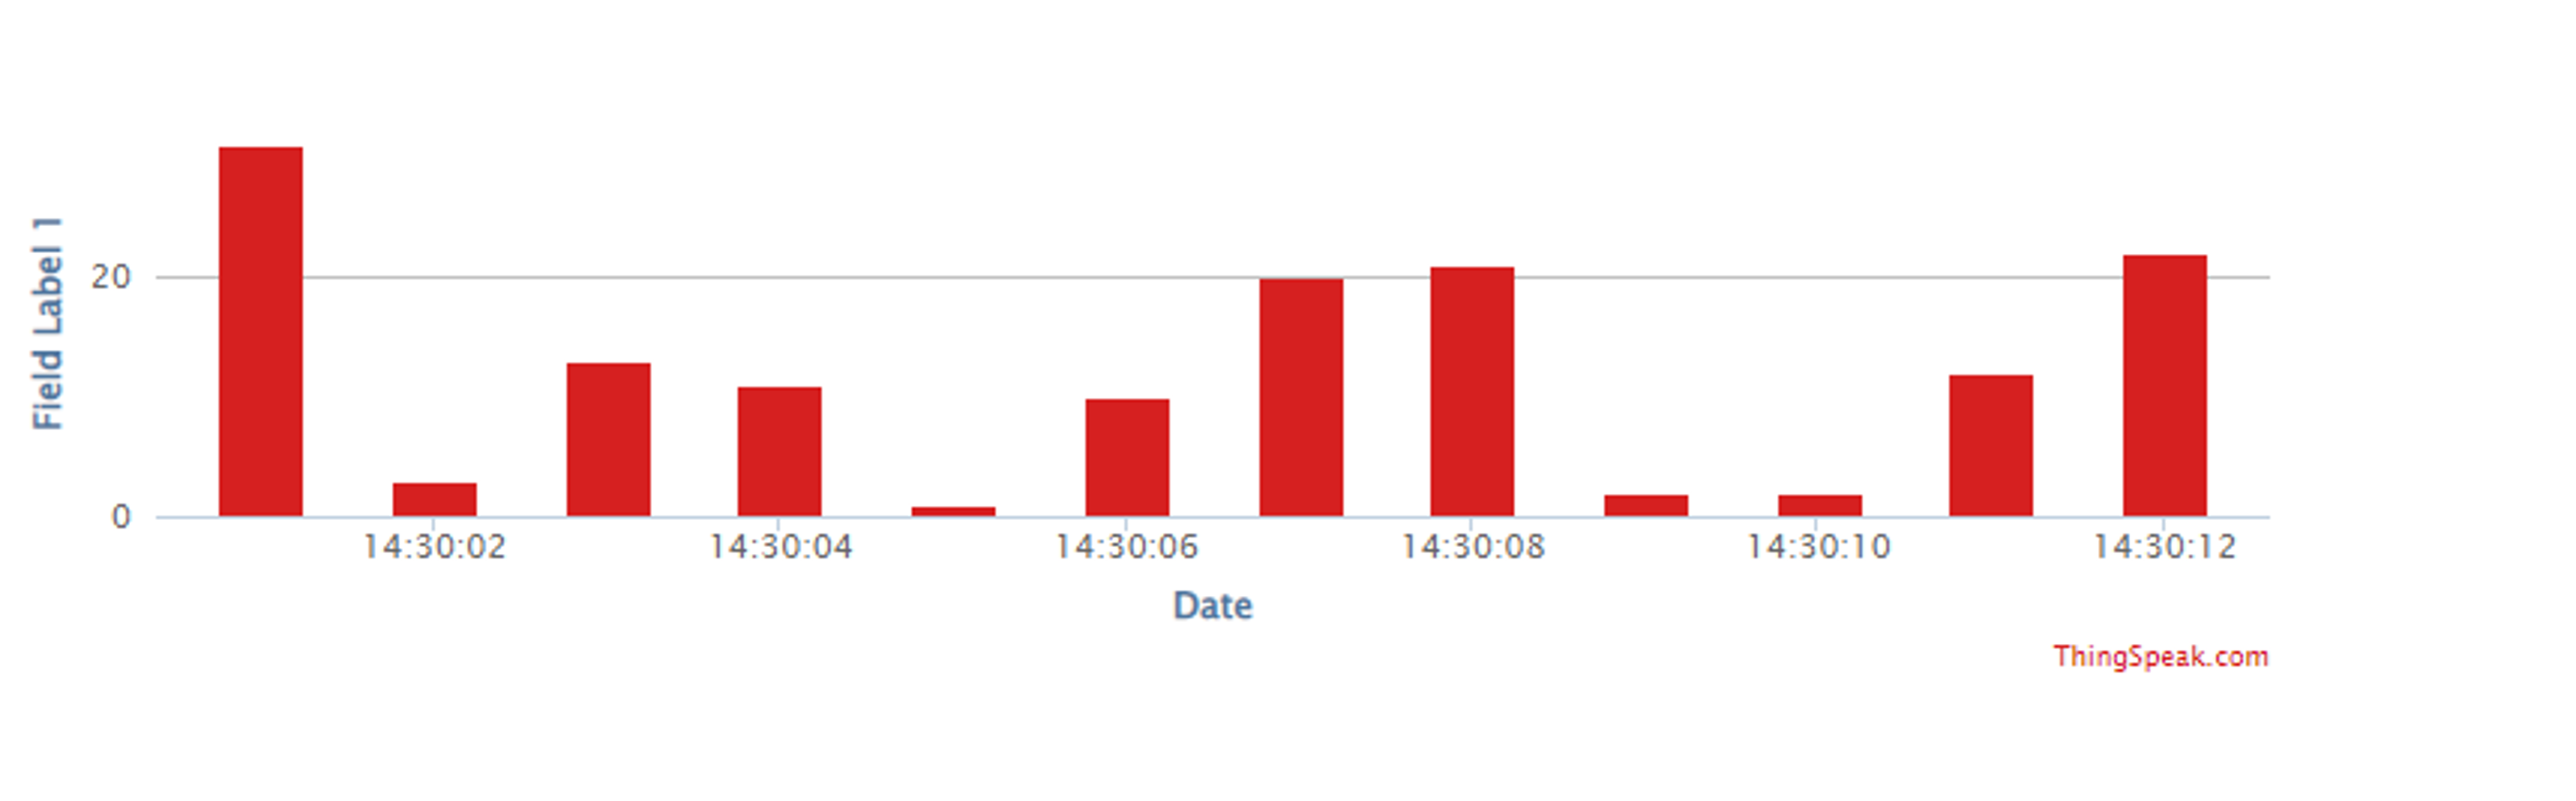
I know its a big hack, so if you need help wiht the MATLAB code for a custom vis, let us know what format the data in in and we can give you some hints.
Christoper, many thanks for your feedback, very usefull and informative!
Ive not started to post the array to thingspeak, before i started i wanted to have a fair idea of how to do it.
The data is sampled and processed in the Arduino (ESP8266) to provide a local display (via UDP on local LAN), aggregate total instantaneous power and aggregate total energy and the individual channel results. I build the arrays in the arduino so i can send them via UDP to the displays.
Essentially i would like to replicate these online for live viewing and later analysis once i lean that.
The latter one certainly makes sense to me, i can work through the array and post values, but im thinking, if i post a result to a channel say every second and show the 12 values on the chart the bars will build 0, 1, 2... 12, | 0, 1, 2...12... etc so as the data ripples along i would end up with, for example, channel 6, 7, 8, ... 0, 1, 2.
This is one of my existing ThinkSpeak postings;
if (enaElec == 1) // from the setup, are we sending this data
{
// Electricity values transmission
ThingSpeak.setField(1, float(elecTimeLastp)); //time between pulses
ThingSpeak.setField(2, elecPulseCount); //
ThingSpeak.setField(3, elecElapsedkWh); //
ThingSpeak.setField(4, elecPowerIn); //
ThingSpeak.setField(5, elecPower); //
ThingSpeak.setStatus(myElecStatus);
// write to the ThingSpeak channel
int elecx = ThingSpeak.writeFields(elecChannel, elecWriteAPIKey);
if (elecx == 200) {
Serial.println("Elec Channel update successful.");
}
else {
Serial.println("Elec Problem updating channel; " + String(elecx));
}
}
It would be great if ThingSpeak could add into any future development plans the ability to write X & Y data eg:
ThingSpeak.setField(n, x_val, y_val)
where for me, n could simply be 1, x_val is 1-12 and y_val the data to plot? The data is all pretty simple, just decimal values.
Or is that your thoughts of using created_at? it is used to define the X value and this could be stamped as 00:01:00 to 00:12:00 for example and just run through these same 12 time values as the created_at?
ThingSpeak is at heart timestamped data. That is how the database is organized, so you have to use that dimension to store your data.
I was trying to use the timestamps to provide something of an X axis so you would get the plot for free in ThingSpeak field charts. The right was to do it is really with MATLAB analysis or visualizations.
You can aready write
ThingSpeak.setField(1,x_val);
ThingSpeak.setField(2,y_val);
then these two points will be correlated in time and you can use that to plot them.
So you can choose to write your data across 12 fields (which needs two cahnnes as you state above)
or you can write it sequentially to the same field and use your knowlege that the data is modulo 12 to read it and product the plot.
plotData=thingSpeakRead(mychannelID, 'numpoints',12);
bar[plotData];
One other option would be to encode the data in a single field since there are 256 characters availalbe.
myString=String(yval1)+ "_" + ...String(yval12)
ThingSpeak.setField(1,myString)
plotData=thingSpeakRead(mychannelID);
plotData=str2double(strsplit(plotData,"_"));
bar(plotData);
You can see the MATLAB code is pretty simple (2-3 lines) and you can juice it up to make your plots look rally classy with custom labels.
标签
您也可以从以下列表中选择网站:
美洲
- América Latina (Español)
- Canada (English)
- United States (English)
欧洲
- Belgium (English)
- Denmark (English)
- Deutschland (Deutsch)
- España (Español)
- Finland (English)
- France (Français)
- Ireland (English)
- Italia (Italiano)
- Luxembourg (English)
- Netherlands (English)
- Norway (English)
- Österreich (Deutsch)
- Portugal (English)
- Sweden (English)
- Switzerland
- United Kingdom(English)
亚太
- Australia (English)
- India (English)
- New Zealand (English)
- 中国
- 日本Japanese (日本語)
- 한국Korean (한국어)