
Eye Diagram Density Plot

EyeDiagram
Better eye diagram generation code in MATLAB. Used a lot in my DPhil Thesis.

How much better?
A before and after is provided here:

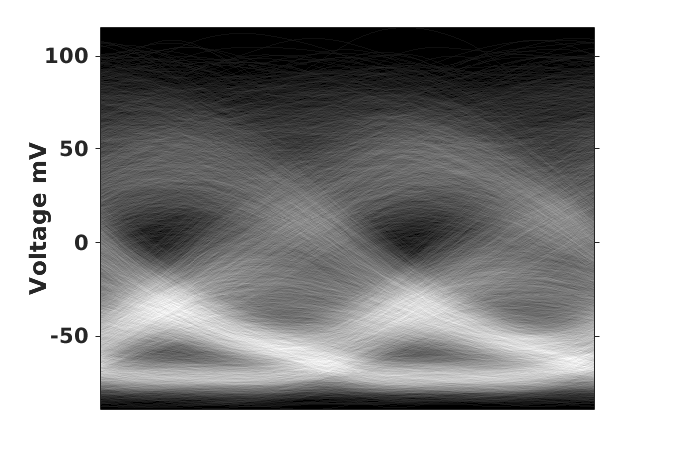
Unlike MATLAB's built in eyediagram() function, the more data you provide eyediagram_dense() the prettier it looks, case in point (for a different communications system with a higher error rate):
What does your code do?
eyediagram_dense creates a raster image of an eye diagram, capturing signal density at each point on the image. This function creates a diagram, alongside returning all the important information captured within it as a MATLAB struct.
eyediagram_dense() also has the ability to detect zero crossings, and automatically label the x axis accordingly.
I mainly work with On-Off Keying, so for the y axis the system is able to detect two levels. In a future update I will be able to detect PAM.
With optional arguments, histograms can be placed along the x and y axis, for zero crossing distributions (a way to test if you have double-Dirac) and to sanity check your bit levels.
What is coming next? My goals for this repo are as follows:
| Goal | Description |
|---|---|
| Q factor estimation | From the eye diagram we can estimate Q factors, which are important quantities to know for any communications system. |
| BER estimation | From calculated Q factors we can estimate the BER. This is handy if we don't have all afternoon to resolve a 10^-12 BER. |
| Eye Opening Metrics | Use standard textbook metrics and return to the user. |
| Jitter | Quantify the jitter and return it to the user. |
| Colormaps | Add colormaps for custom eye diagram output |
| More... | I'm sure I've missed lots, but more eye diagram related features will be included |
引用格式
William Matthews (2026). Eye Diagram Density Plot (https://github.com/WillMatthews/EyeDiagram/releases/tag/v0.0.2), GitHub. 检索时间: .
MATLAB 版本兼容性
平台兼容性
Windows macOS Linux标签
| 版本 | 已发布 | 发行说明 | |
|---|---|---|---|
| 0.0.2 | See release notes for this release on GitHub: https://github.com/WillMatthews/EyeDiagram/releases/tag/v0.0.2 |
||
| 0.0.1 |
您也可以从以下列表中选择网站:
美洲
- América Latina (Español)
- Canada (English)
- United States (English)
欧洲
- Belgium (English)
- Denmark (English)
- Deutschland (Deutsch)
- España (Español)
- Finland (English)
- France (Français)
- Ireland (English)
- Italia (Italiano)
- Luxembourg (English)
- Netherlands (English)
- Norway (English)
- Österreich (Deutsch)
- Portugal (English)
- Sweden (English)
- Switzerland
- United Kingdom (English)
亚太
- Australia (English)
- India (English)
- New Zealand (English)
- 中国
- 日本Japanese (日本語)
- 한국Korean (한국어)