WAQI (World Air Quality Index) API client
WAQI client for MATLAB
WAQI (World Air Quality Index) provides open API for reading air quality data from the stations registered on the project.
Get your API token
Request the WAQI API access token at https://aqicn.org/api/.
Usage
Air quality data for the given location
token = "<your token>";
aqi = waqi.WAQI(token);

% Get data for the given known city
bangkok = aqi.city("bangkok");

% Get data from the nearest station for given coordinates
seattle = aqi.nearest([47.62050, -122.34930]);
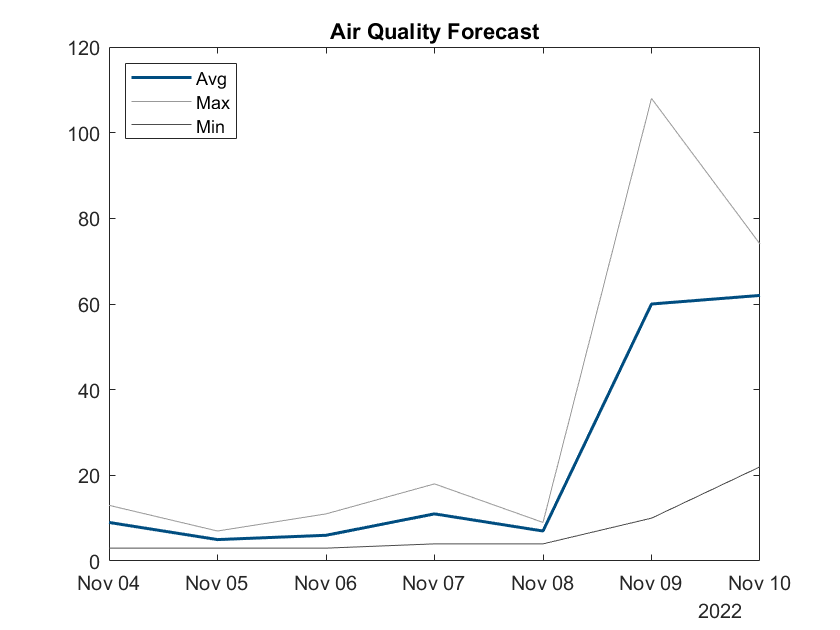
Plot received forecast data:
forecast = seattle.Forecast.pm25;

figure
plot(forecast.Time, forecast.Avg, Color="black", LineWidth=1.5, Color=[0, 0.3, 0.5])
title("Air Quality Forecast")
hold on
plot(forecast.Time, forecast.Max, Color=[0.6, 0.6, 0.6])
plot(forecast.Time, forecast.Min, Color=[0.3, 0.3, 0.3])
legend(["Avg", "Max", "Min"], Location="northwest")
hold off
List of stations for the given geographical area
% Geographic boundary
chiang_mai_area = [
    geopoint(19.05580, 98.53775)
    geopoint(18.41727, 99.32121)
];

% Get list of stations
result = aqi.stations(chiang_mai_area)
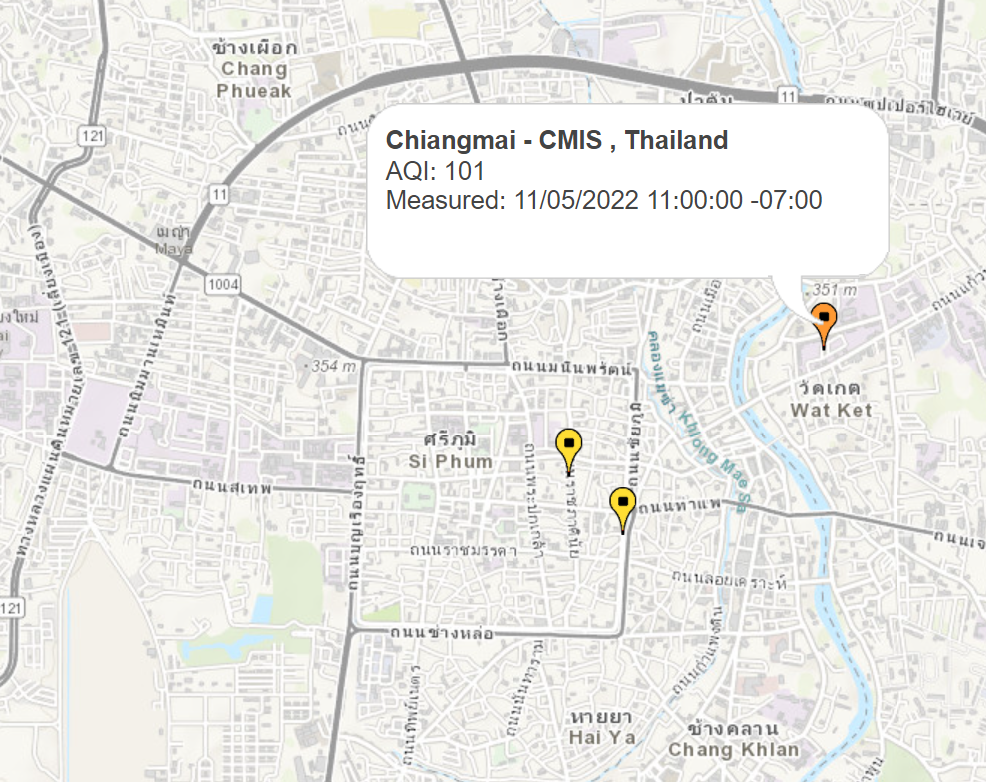
Result includes locations of returned stations, station information and current readings of AQI:

Display stations on the map:
station_names = [result.Station.Name];
station_descriptions = arrayfun(@(a, t) sprintf("AQI: %.0f<br/>Measured: %s", a, string(t, "M/dd/yyyy hh:mm:ss XXX")), result.AQI, result.Timestamp);

colors = cell2mat(arrayfun(@colorcode, result.AQI, UniformOutput=false));

wmmarker(result.Location, FeatureName=station_names, Description=station_descriptions, Color=colors);

% A helper function to color code values of AQI
function color = colorcode(aqi)
    if aqi <= 50
        % Good
        color = [0, 153/255, 102/255];
    elseif aqi <= 100
        % Moderate
        color = [1, 222/255, 51/255];
    elseif aqi <= 150
        % Unhealthy for Sensitive Groups
        color = [1, 153/255, 51/255];
    elseif aqi <= 200
        % Unhealthy
        color = [204/255, 0, 51/255];
    elseif aqi <= 300
        % Very Unhealthy
        color = [102/255, 0, 153/255];
    else
        % Hazardous
        color = [126/255, 0, 35/255];
    end
end
Air quality data for a specific station
% Find station with the worst AQI
[~, i] = max(result.AQI);
worst_station = result.Station([i(1)]);

% Get air quality data for given station
measurements = aqi.station(worst_station)
引用格式
Sergey Kostrukov (2024). WAQI (World Air Quality Index) API client (https://github.com/kostrse/waqi-matlab/releases/tag/v0.3), GitHub. 检索时间: .
MATLAB 版本兼容性
平台兼容性
Windows macOS Linux标签
Community Treasure Hunt
Find the treasures in MATLAB Central and discover how the community can help you!
Start Hunting!+waqi
+waqi/+internal
| 版本 | 已发布 | 发行说明 | |
|---|---|---|---|
| 0.3 | See release notes for this release on GitHub: https://github.com/kostrse/waqi-matlab/releases/tag/v0.3 |
||
| 0.2 | See release notes for this release on GitHub: https://github.com/kostrse/waqi-matlab/releases/tag/v0.2 |
||
| 0.1 |


