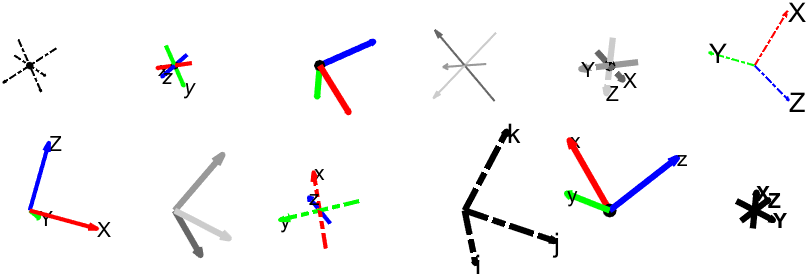
plotframe: Plot a 3-D Cartesian coordinate system
hg = plotframe( rotationMatrix, translationVector, basisVectorLengths, Name=Value )

引用格式
George Abrahams (2023) (https://www.linkedin.com/in/georgeabrahams). plotframe: Plot a 3-D Cartesian coordinate system (https://github.com/WD40andTape/plotframe/releases/tag/1.0.0), GitHub. Retrieved December 14, 2023.

| 版本 | 已发布 | 发行说明 | Action |
|---|---|---|---|
| 1.0.2 | See release notes for this release on GitHub: https://github.com/WD40andTape/plotframe/releases/tag/1.0.2 |
||
| 1.0.1 | See release notes for this release on GitHub: https://github.com/WD40andTape/plotframe/releases/tag/1.0.1 |
||
| 1.0.0 |
要查看或报告此来自 GitHub 的附加功能中的问题,请访问其 GitHub 存储库。
要查看或报告此来自 GitHub 的附加功能中的问题,请访问其 GitHub 存储库。

