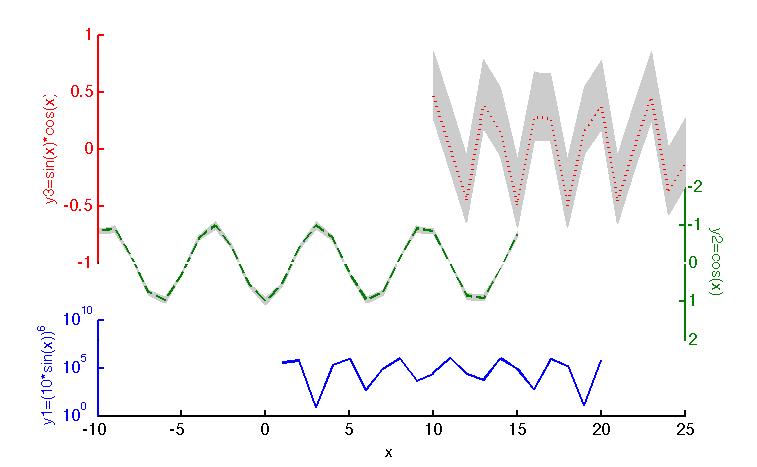
Myplotyy
Myplotyy plots different data sets with a common x-axis but using individual y-axes in one figure.

引用格式
Friedhelm Steinhilber (2026). Myplotyy (https://ww2.mathworks.cn/matlabcentral/fileexchange/26550-myplotyy), MATLAB Central File Exchange. 检索时间: .
| 版本 | 已发布 | 发行说明 | Action |
|---|---|---|---|
| 1.7.0 | Fix of ylabel positions |
||
| 1.5.0 | The label on the right side is now at the correct position. |
||
| 1.4.0 | update of the description |
||
| 1.3.0 | updated description |
||
| 1.2.0 | fixed a problem considering the rotation of the y-labels. |
||
| 1.1.0 | now the function is also able to plot confidence intervals |
||
| 1.0.0 |

