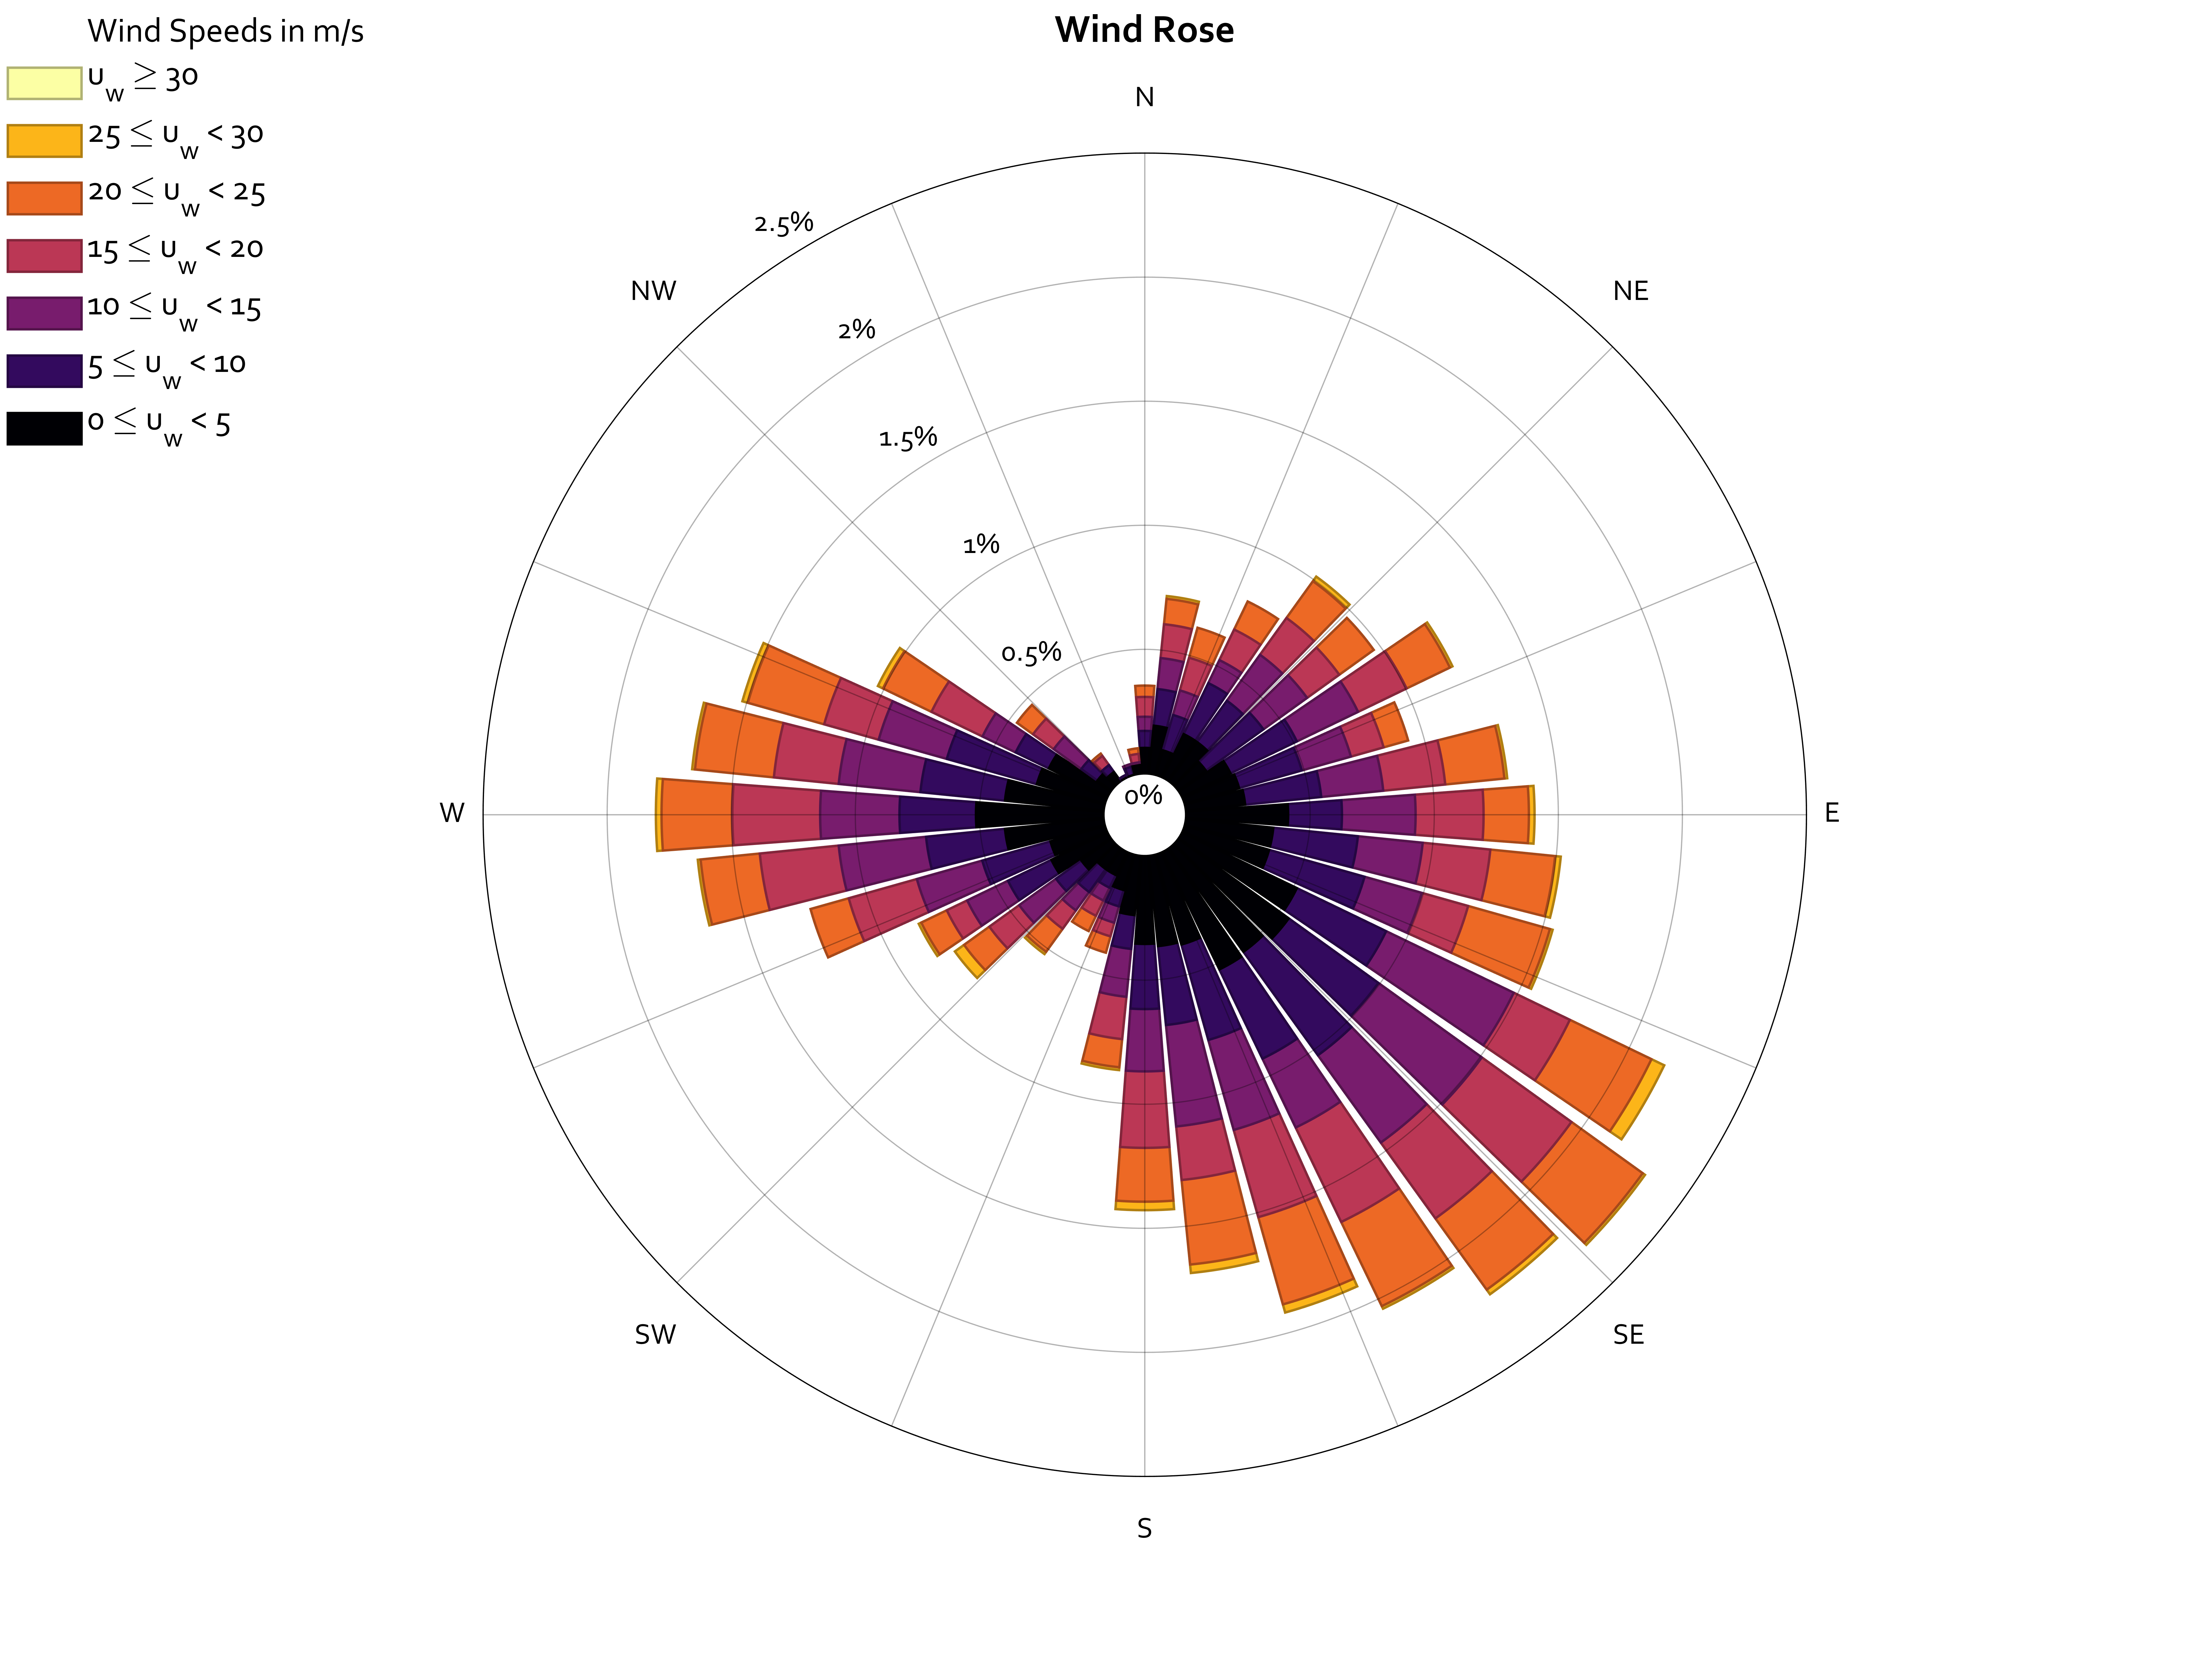
Wind Rose
Graph and table for Direction-Intensity data
引用格式
Daniel Pereira (2026). Wind Rose (https://ww2.mathworks.cn/matlabcentral/fileexchange/47248-wind-rose), MATLAB Central File Exchange. 检索时间: .
| 版本 | 已发布 | 发行说明 | Action |
|---|---|---|---|
| 2.1.0 | Normalization, Logarithmic scale and more. See full Changelog in project's web page:
Donations are welcome:
|
||
| 2.0.1 | Documentation added for Legend position and orientation.
Donations are welcome:
|
||
| 2.0.0 | See Changelog in project's web page: https://dpereira.asempyme.com/windrose/ Thanks to all the users and special thanks to José Miguel Jaúregui, Naxya and Clive Holden from Oceanographic Field Services, for their support. |
||
| 1.7.0 | Changed description |
||
| 1.7.0-1 | Changed description |
||
| 1.7.0-0 | Added option to show frequencies as in a ruler (thanks to Jacqueline Freire Rigatto for the idea)
|
||
| 1.6.0 | Donations are welcome:
|
||
| 1.6.0-2 | Added reference to Matlab blogs |
||
| 1.6.0-1 | Documentation updated |
||
| 1.6.0-0 | Added option to plot the windrose in the desired position (X,Y) in a plot, combined with scalefactor.
|
||
| 1.5.0 | Updated Image to fit preview size |
||
| 1.5.0-2 | Updated image |
||
| 1.5.0-1 | Corrected the issue with scale factor, which displayed wrong frequency values and wrong radial grid lines. |
||
| 1.5.0-0 | Changed the way in which labels are read. The order now should be 'North','East','South','West'.
|
||
| 1.3.1 | Corrected histogram count inside function "PivotTableCount", which didn't consider always values greater than the max(vwinds) value. |
||
| 1.3.0 | Added option to create the wind rose graph in specified axes (subplot or previously created axes).
|
||
| 1.2.0 | Some functionalities addes (specifying the speed ranges in a vector, scaling the wind rose inside the figure, different legends, titles, texts). Documentation inside submission. |
||
| 1.1.0 | Options to hide/show figure menubar and toolbar
|
||
| 1.0.0 |

