PlotLogCompand
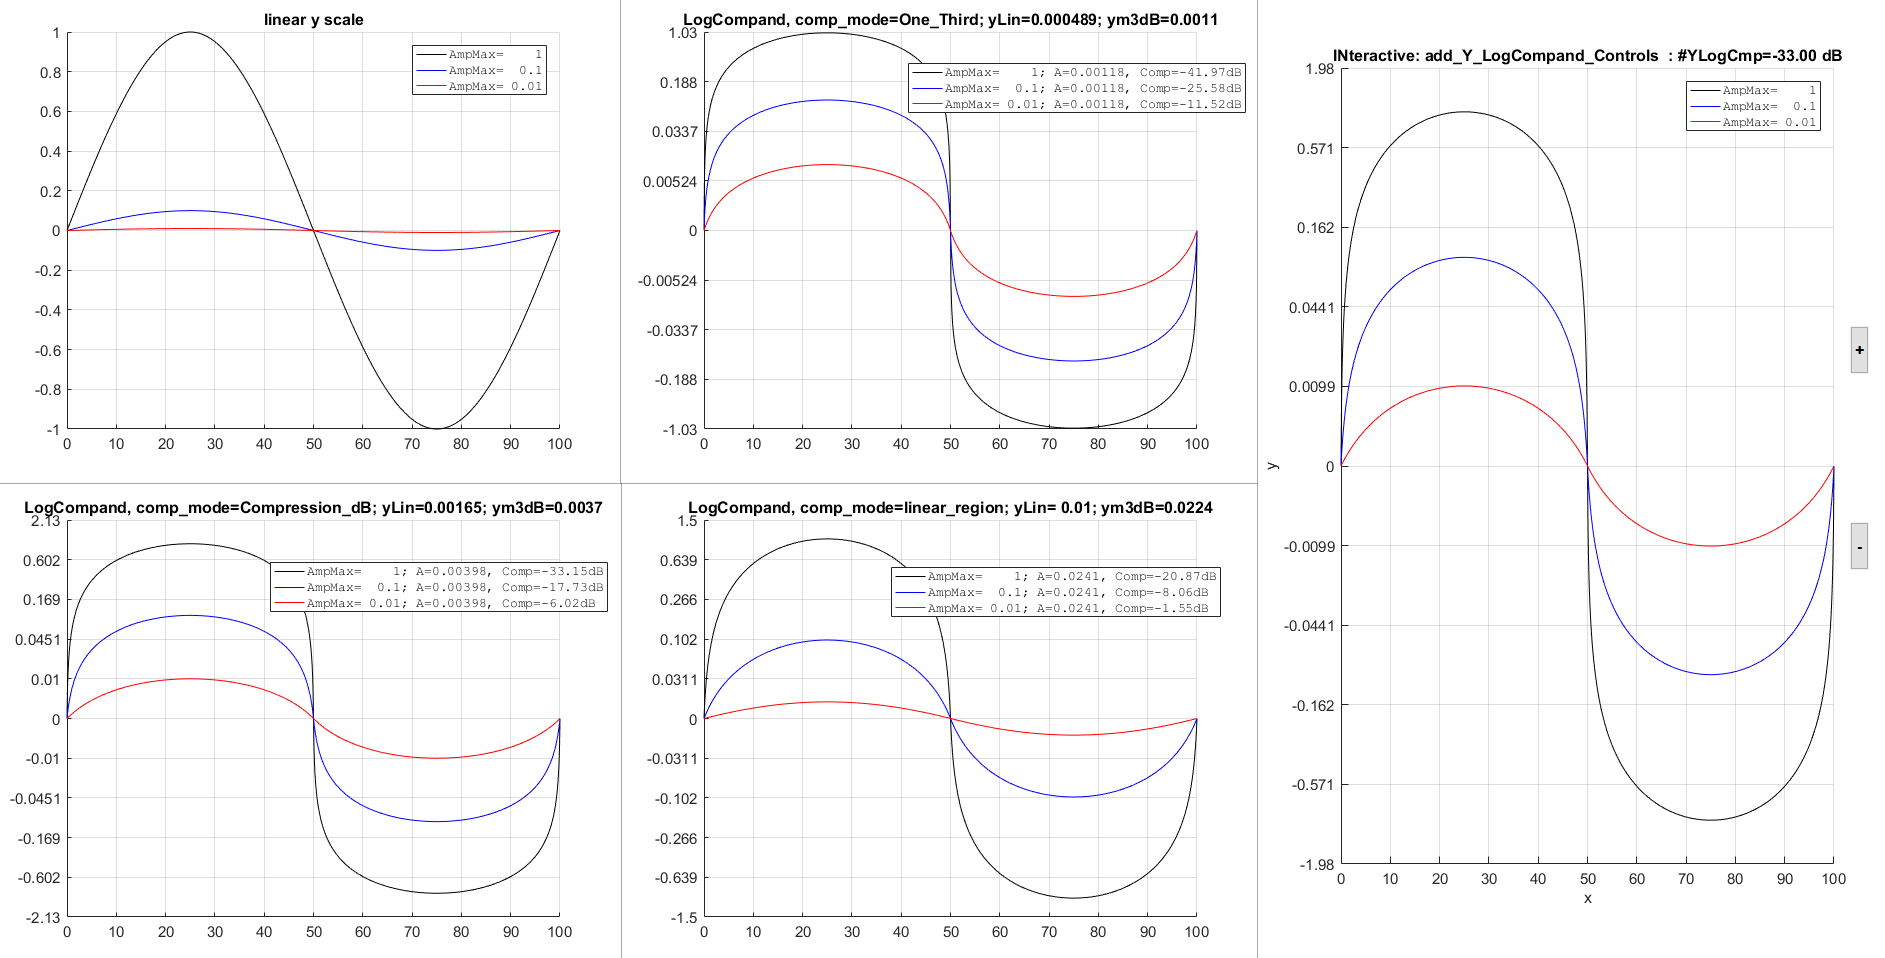
Two functions to plot diverse y dynamic ranges into one axis with ticks on axis, and continuous compression across y=0.

引用格式
Massimo Ciacci (2026). PlotLogCompand (https://ww2.mathworks.cn/matlabcentral/fileexchange/72948-plotlogcompand), MATLAB Central File Exchange. 检索时间: .
| 版本 | 已发布 | 发行说明 | Action |
|---|---|---|---|
| 1.0.0 |

