主要内容
7 个结果

Plot lines with different line styles, line colors, and markers

Wrapper for pcolor that behaves similarly to imagesc. Squash OS X Preview's "blurry image" bug!

This function returns normalized coordinates in plot, semilogx, semilogy and loglog plots.

Zooming and panning with the mouse in 2D plots. Supports plotyy, loglog, subplot, etc.

Add multiple X or Y axes to plots, rescale data, use any function, add data tips, zoom, flexible.
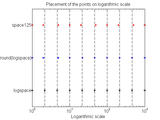
Generate points ..., 1, 2, 5, 10, 20, ... often useful for log-plots when integer values needed.

Generate engineering-notation spaced tick in a x-axis logarithmic frequency plot (semilogx or loglog)
您也可以从以下列表中选择网站:
美洲
- América Latina (Español)
- Canada (English)
- United States (English)
欧洲
- Belgium (English)
- Denmark (English)
- Deutschland (Deutsch)
- España (Español)
- Finland (English)
- France (Français)
- Ireland (English)
- Italia (Italiano)
- Luxembourg (English)
- Netherlands (English)
- Norway (English)
- Österreich (Deutsch)
- Portugal (English)
- Sweden (English)
- Switzerland
- United Kingdom(English)
亚太
- Australia (English)
- India (English)
- New Zealand (English)
- 中国
- 日本Japanese (日本語)
- 한국Korean (한국어)