主要内容
5 个结果

Plot lines with different line styles, line colors, and markers

Wrapper for pcolor that behaves similarly to imagesc. Squash OS X Preview's "blurry image" bug!

This function returns normalized coordinates in plot, semilogx, semilogy and loglog plots.

Add multiple X or Y axes to plots, rescale data, use any function, add data tips, zoom, flexible.
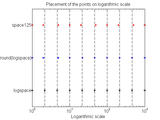
Generate points ..., 1, 2, 5, 10, 20, ... often useful for log-plots when integer values needed.
您也可以从以下列表中选择网站:
美洲
- América Latina (Español)
- Canada (English)
- United States (English)
欧洲
- Belgium (English)
- Denmark (English)
- Deutschland (Deutsch)
- España (Español)
- Finland (English)
- France (Français)
- Ireland (English)
- Italia (Italiano)
- Luxembourg (English)
- Netherlands (English)
- Norway (English)
- Österreich (Deutsch)
- Portugal (English)
- Sweden (English)
- Switzerland
- United Kingdom(English)
亚太
- Australia (English)
- India (English)
- New Zealand (English)
- 中国
- 日本Japanese (日本語)
- 한국Korean (한국어)