visualize
Syntax
Description
visualize( displays the design
power spectral density (PSD), realized PSD, and the
phasenoise)MinFrequencyOfffset of the NR phase noise added to the input
signal by the nrPhaseNoise
System object™. In the resulting display you can see:
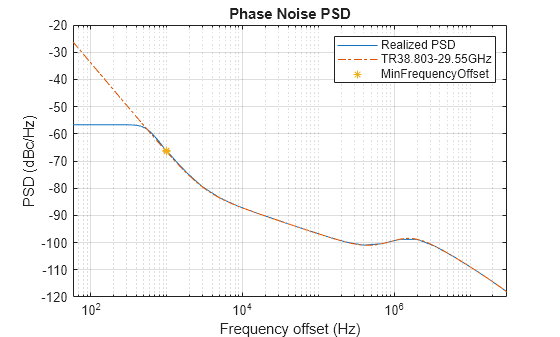
Design PSD Plot — The design PSD plot shows the intended phase noise spectrum across frequency offsets from the carrier. It represents the target noise profile that the system aims to achieve.
Realized PSD Plot — The realized PSD plot displays the phase noise PSD realised by the System object.
Minimum frequency offset — The x-axis represents the minimum frequency offset from the carrier frequency.
Note
Code generation is not supported for this visualize object
function.
Examples
Create an nrPhaseNoise object with default properties.
phasenoise = nrPhaseNoise
phasenoise =
  nrPhaseNoise with properties:

      CarrierFrequency: 3.0000e+10
         PoleZeroModel: "TR38.803-auto"
            SampleRate: 61440000
    MinFrequencyOffset: 1000
          RandomStream: "global"
Visualize the characteristics of the default NR multi-pole/zero model.
visualize(phasenoise)
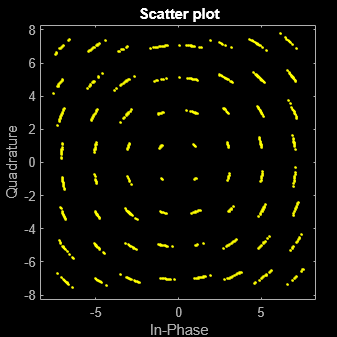
Generate a 64-QAM signal.
M = 64;
data = randi([0 M-1],1000,1);
modData = qammod(data,64);
Apply the phase noise to the signal.
y = phasenoise(modData);
Plot the impaired signal.
scatterplot(y)
Input Arguments
Limitations
Code generation is not supported for this
visualizeobject function.
Version History
Introduced in R2026a